Active Transportation Infrastructure

Equity-Indicators-Active-Transportation-Infrastructure

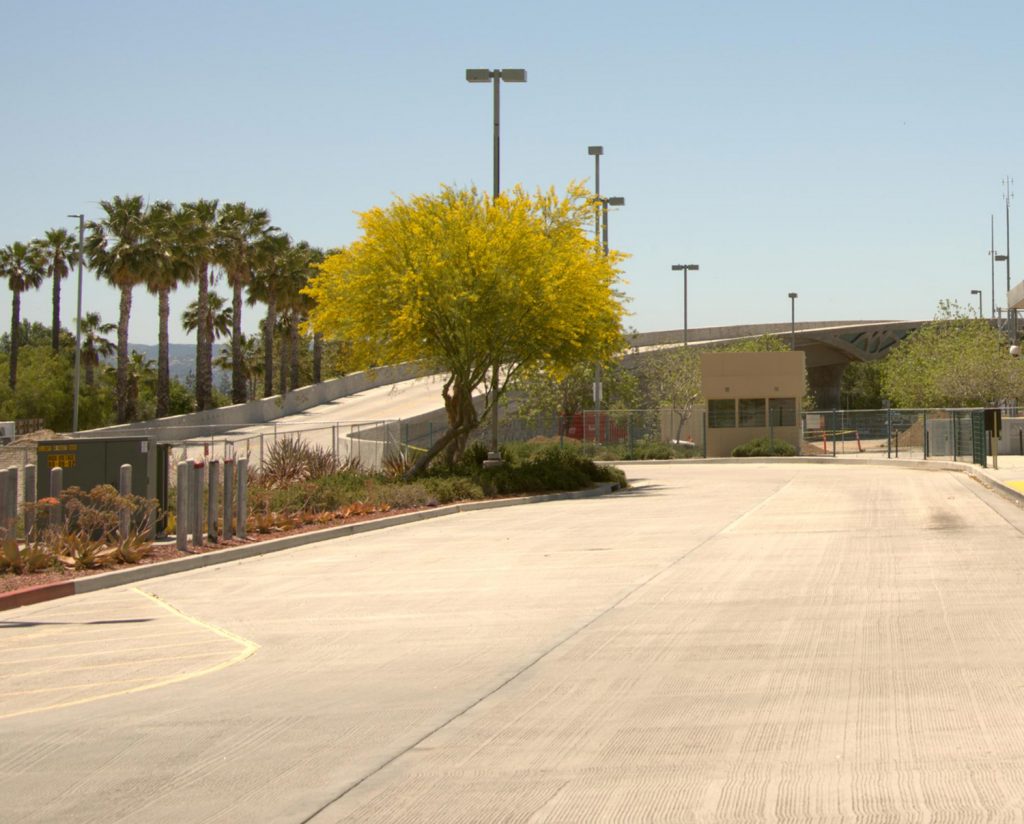
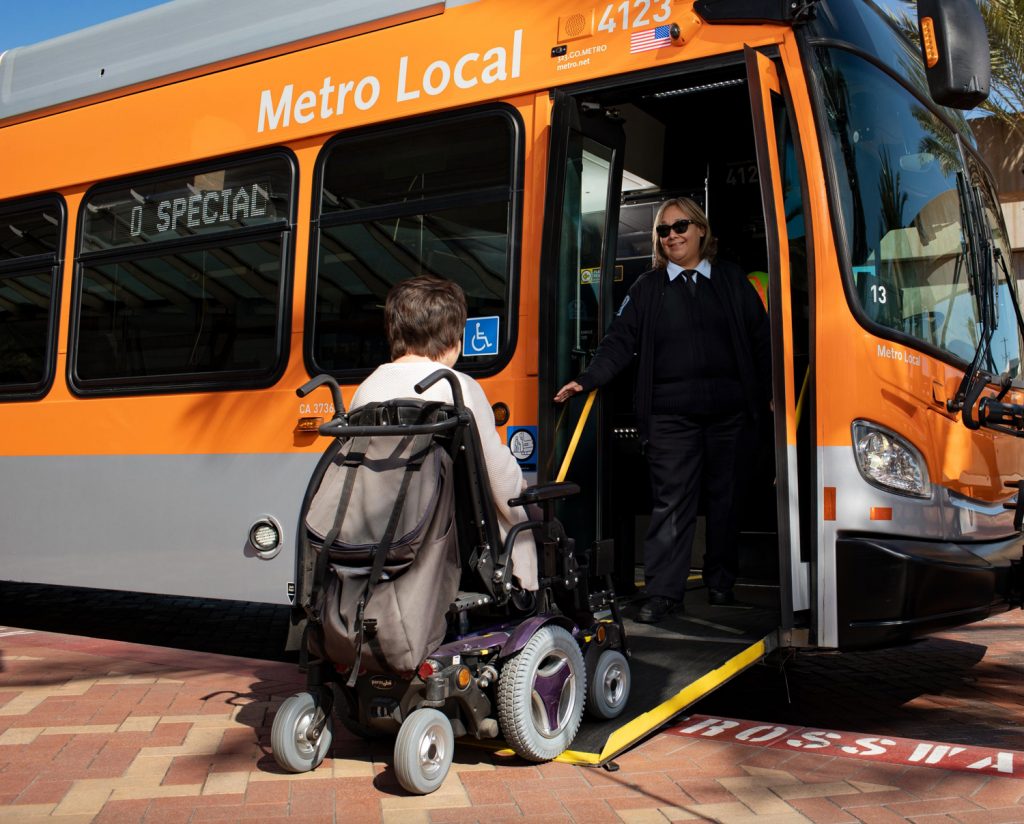
Active transportation infrastructure refers to aspects of the physical environment that supports safe, accessible and convenient modes of non-motorized travel, such as walking, cycling, rolling (e.g., scooters, skateboards, wheelchairs) and connections to public transit. This indicator measures how effectively the physical environment supports all populations seeking to travel on foot or non-motorized wheels, either independently or when paired with public transit. Active transportation infrastructure is a key component of transit accessibility. Poor walking and rolling infrastructure can discourage public transit use, which can disproportionately impact low-income communities who are more likely to rely on active and public transportation to reach key amenities and services. Improved active transportation options can also support agency-wide goals for enhanced first/last mile connectivity and reduced regional Vehicle Miles Traveled (VMT).

Understand Your Datasets

For projects within the City of Los Angeles, the City’s Mobility Plan 2035 establishes a policy foundation for active transportation infrastructure. The Plan includes network maps that focus on various modal choices including Pedestrian Enhanced Districts, which refer to areas where pedestrian safety improvements could be prioritized to improve walking connections.

Bikeways offer an alternative to rail, buses or walking. Bikeways refer to lanes, routes and paths that are specifically designated for cyclists. Bikeways are often delineated by class, which refers to whether a given bikeway is shared with or physically protected from motorized traffic. Bikeability assessments and checklists, such as the City of LA’s Bikeable Design toolkit, can provide quantitative measures of how bike-friendly a given location is and establish a standardized way of understanding the quality and safety of bikeways.

The Southern California Association of Governments (SCAG) has developed an Active Transportation Plan Toolkit that provides a suite of resources for communities to develop an active transportation improvements. SCAG also regularly reports on planning and design considerations for improving active transportation infrastructure. According to SCAG, 56% of its High Injury Network—which identifies stretches of roadways where the highest concentrations of collisions occur—is in Disadvantaged Communities (DACs). Planners can use data sources like active transportation usage metrics, walk and roll counts, sidewalk and shade quality and nearby services and amenities to prioritize, track and evaluate projects in these communities.

Example Datasets:


1. Los Angeles City Planning Mobility Plan 2035 Pedestrian Enhanced District analysis areas:
https://mp35implementation.lacity.gov/

Instructions: Open the online web map and locate your area of interest OR download a geospatial file. This geospatial file can load into a GIS software of choice. Pedestrian Enhanced Districts are represented by polyline data.

Data Considerations: Pedestrian Enhanced Districts were defined in LA County Planning’s 2035 Mobility Plan released in 2015 and amended in 2016. The web map and geospatial data were published in 2020 and last updated in March 2024.


2. LA County Department of Public Works Bikeways Map:
https://dpw.lacounty.gov/bike/map.cfm

a. Note: LA County is currently updating its Bike Master Plan, which can be reviewed here: https://pw.lacounty.gov/tpp/bmp/network-map

Instructions: Open the online map and locate your area of interest. Existing bikeways across LA County are available, including those maintained by the organizations other than the county government. Additionally, proposed bikeways from LA County’s Bicycle Master Plan are also available.

Data Considerations: Planned bikeways are from the 2012 Los Angeles County Bike Master Plan, which is part of the Mobility Element of the County’s General Plan. Data for bikeways “Maintained by Others” is obtained from Metro’s 2016 ATSP dataset. The web map was published in 2020 and last updated in May 2024.


3. SCAG Transit Accessibility Guidelines:
https://scag.ca.gov/sites/default/files/2024-05/3038_scag-rdtlstransitpriority_final.pdf and Active Transportation Plan Toolkit: https://scag.ca.gov/active-transportation

Instructions: These resources contain considerations for active transportation infrastructure ranging from the project identification and prioritization stage to implementation phase, as well as an Active Transportation Plan Toolkit and guide for funding.

Data Considerations: Transit Priority Best Practices are from a 2022 study by the Southern California Association of Governments focused on regional dedicated transit lanes.


Community Demographics Profiles Alignment

Transportation Mode by Race/Ethnicity
Caltrans Equity Index
Households with no Access to a Vehicle

Explore the Index of Indicators in Metro’s Community Demographics Profiles Dashboard here.

Coordinate-with-community-members
Coordinate with Community Members
Active transportation infrastructure improvement efforts and engagement activities should be aligned with Metro’s Transit Oriented Communities Policy, which formalizes our commitment to strengthen synergies between transit and surrounding streets throughout Greater Los Angeles. Planners may choose to assess the current state of active transportation infrastructure by conducting neighborhood walks, targeted interviews or surveys along key active transportation corridors (e.g., major sidewalks, bikeways, bike share stations). Assess active infrastructure quality with input from Metro riders and non-riders to understand barriers to ridership and community priorities. Discuss with community members how your project may influence personal vehicle use to better understand your initiative’s role in agency-wide Vehicle Miles Traveled (VMT) goals.

Consider the successes and failures of past pedestrian improvement projects and ensure that efforts align with the lived experiences of residents in the neighborhood. Focus outreach in areas near public transit hubs in coordination with Metro’s First/Last Mile connectivity initiatives and in support of transit-oriented development. If infrastructure improvement projects impact mobility in the short and long term, consider implementing a construction management plan. This plan should be informed by external stakeholder engagement to minimize or eliminate temporary construction-related inconveniences. Include a robust feedback mechanism, performance monitoring and reporting for these impacts.

< go back to Use Data and Indicators page

Questions about this page’s vocabulary terms? Go to the Know the Vocabulary page

Wondering about relevant policies? Go to the Review the Relevant Policies page

Looking for engagement techniques? Go to the Engage Stakeholders page

Related Equity Indicators

Equity-Indicators-Accessibility

Accessibility

Suggested Baseline Indicator: Accessible transit provides safe mobility options for customers of varying priorities and abilities.

Read More
Equity-Indicators-UHI-Effect

Urban Heat Island (UHI) Effect

Dense, paved urban areas retain more heat which can affect comfort at transit stops, ridership and infrastructure integrity. Planning for shade and cooling can improve rider experience and system resilience.

Read More
Equity-Indicators-Walkability

Walkability

Walkable neighborhoods provide safe and easy access to transit options, employment, healthcare, education, recreation and other critical services.

Read More