Use Data and Indicators

Metro has developed wide-ranging resources to help Metro staff and partners identify data sources and apply key equity indicators to their projects. These practical tools enable Metro staff members and collaborators to successfully complete Metro equity assessments, as well as deepen their knowledge of equity considerations in transportation initiatives.

Jump to:

Explore Metro’s Community Data Dashboards

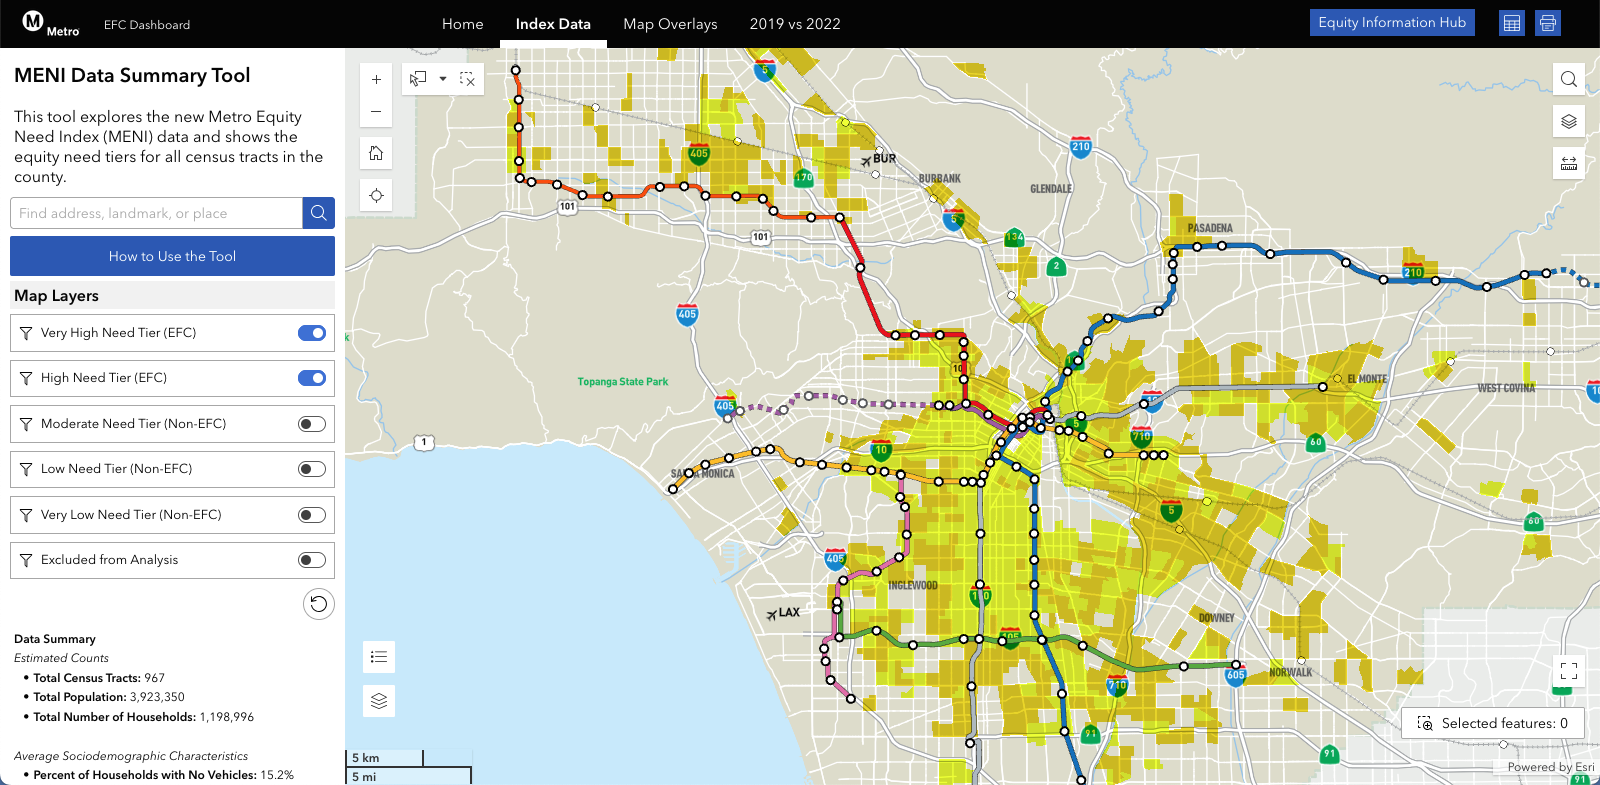
MENI-Data-Summary-Tool

The Equity Focus Communities (EFC) Dashboard helps
Metro identify where transportation needs are greatest. By accounting for different histories and priorities of communities
across LA County, the EFC Map supports our understanding of and commitment to equitable service, project delivery, policymaking and resource distribution. The EFC Map integrates three statistics associated with mobility barriers: Low-income households; Black, Indigenous, and other People of Color (BIPOC Residents); and Households with no access to a car. The EFC Dashboard shows the latest EFC Map as well as other helpful resources:

  • Metro Equity Need Index Data at the county level
  • Map overlays to compare the EFC Map with other information
  • Quick access to shapefiles, data tables, dictionaries, and more
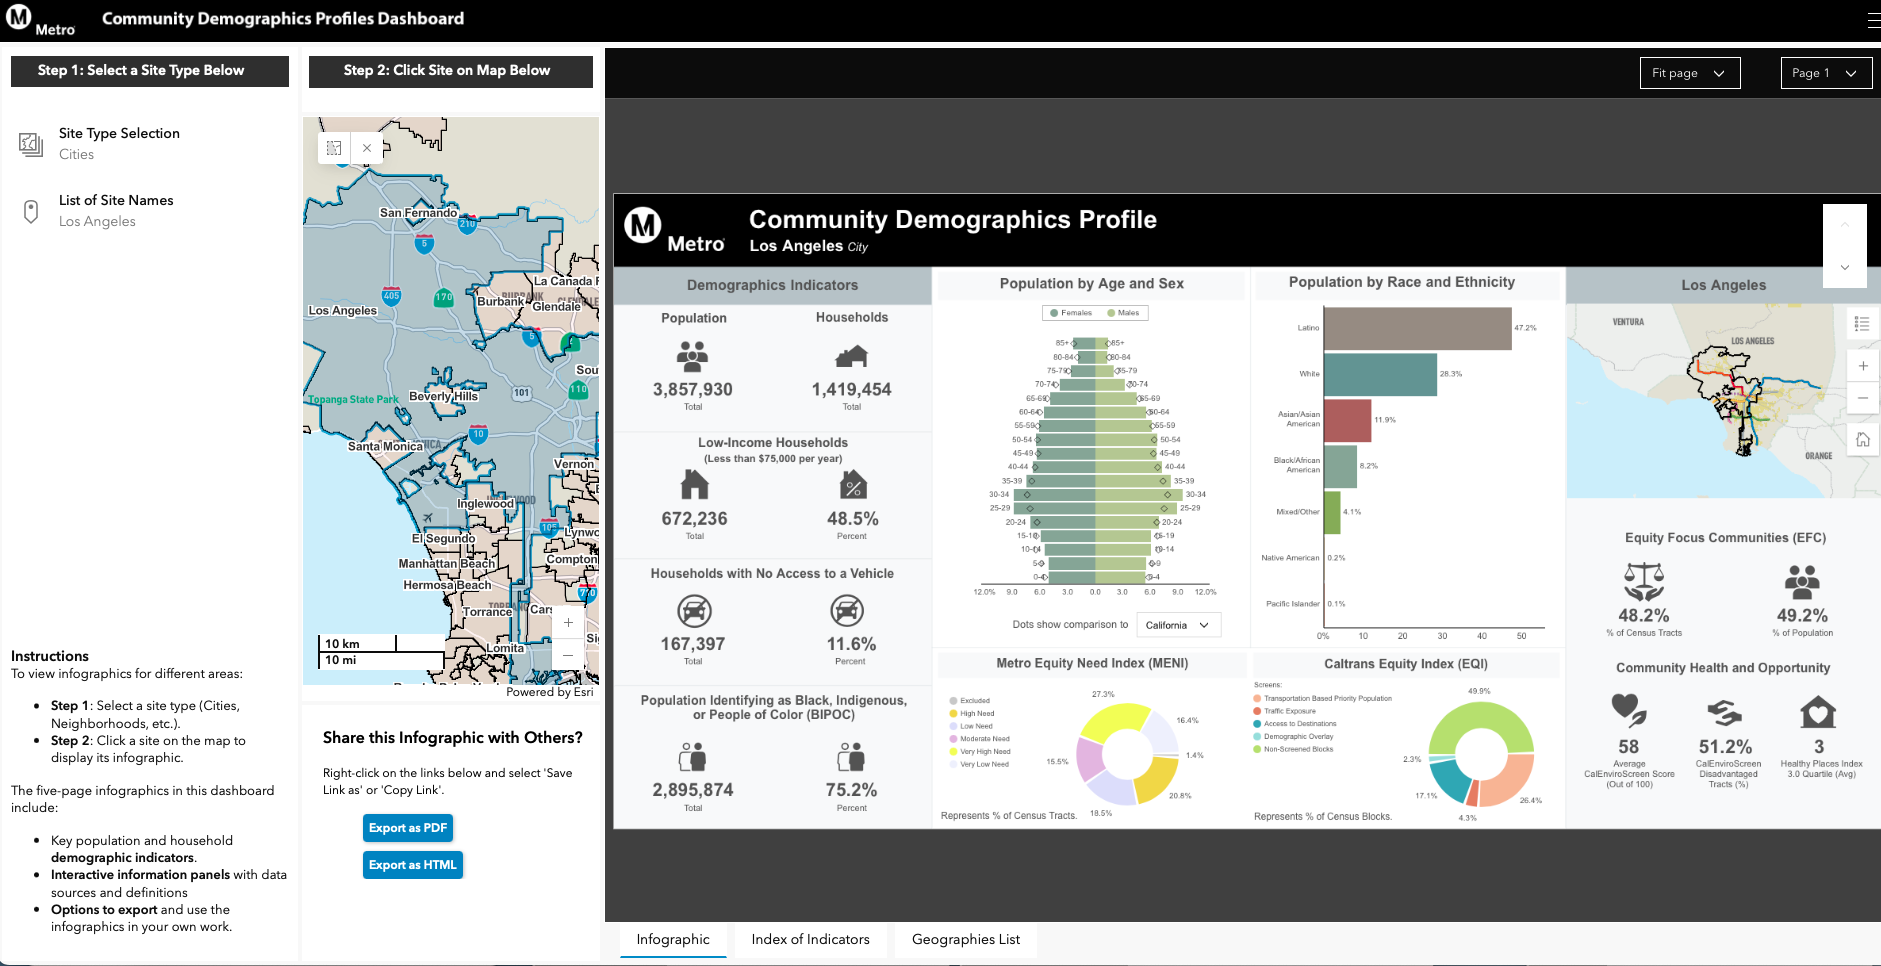
Metro-Toolkit-Community-Demographics-Dash-screenshot

Our Community Demographics Profiles Dashboard (CDP Dashboard) allows Metro staff to quickly identify baseline demographic information for a predefined LA County or Metro-specific geography. A supplement to the EFC Dashboard, each Profile features pre-generated infographics with key data that staff can consider when performing their equity analyses and includes:

  • Key population and household demographic data
  • Interactive information panels with data sources and definitions
  • Options to export and use the infographics in your own work

The VMT and Equity Intersection

Metro is one of the first transit agencies in the U.S. to adopt regional Vehicle Miles Traveled (VMT) reduction targets. Evaluating a project’s VMT impacts is a key part of comprehensive equity assessments. The Equity Indicators below can help Metro staff consider equity holistically while supporting the agency’s broader VMT mitigation goals.

Review the Equity Indicators

Metro’s Office of Equity and Race (OER) developed Equity Indicators to enable staff and partners to assess a range of equity-related considerations in their projects and better understand the scope of a project’s potential impacts in a given community. Metro will use these Indicators to measure potential equity impacts for our projects. Evaluating these Indicators is also a key step in completing a Metro equity assessment. In this Toolkit, each Equity Indicator is accompanied by a brief description, examples of quantitative and qualitative data sources to deepen your understanding of how an Indicator points to effects at the community level and considerations for how to best engage with community members on topics relevant to the Indicator.

Project Factors

Our Equity Indicators are aligned with project factors that highlight key considerations and priorities for initiatives that are important to Metro communities.

These project factors were informed by planning documents like Metro’s Long Range Transportation Plan and are designed to cover a range of equity-related topics for planning and implementation of Metro projects. Project factors provide a preliminary lens through which Equity Indicators can be selected or evaluated; multiple project factors⁠, or other equity considerations, may apply to any given Indicator.

Access

Access to opportunity is a priority for Metro. Transportation is an essential lever for enabling community members opportunities to access jobs, housing, education, health care and other community resources. Access to opportunity also means expanding mobility options and modes by designing an inclusive and equitable transit system for all customers, ensuring that all vehicles, facilities, programs and services are not only compliant with federal Americans with Disabilities Act (ADA) requirements but go above and beyond compliance by adopting useable and future-proofed solutions. (Read More: Accessibility on Metro – LA Metro, Metro Equity Platform)

Safety and Health Benefits

Metro defines Safety as implementing solutions that connect communities and enhance system resilience to create a secure and welcome transit environment for everyone. Metro strives to improve safety, cleanliness and comfort for not just riders on the Metro system but also bicyclists, pedestrians and other Angelenos in transit, therefore enhancing the safety of the region as a whole. (Read more: Sustainability – LA Metro, Everyone Deserves a Safe Metro – LA Metro, Metro Resilience and Climate Adaptation)

Reliability

Metro defines Reliability as transportation infrastructure investments that improve access to transit through enhanced connectivity, minimized travel time, increased directness of routes and overall dependability of the service, making public transit an efficient choice for riders. Enhancing reliability can encourage public transportation use and increase the viability of transit for Angelenos. (Read more: Metro’s Customer Experience Hub)

Affordability

Metro views Affordability as a holistic goal achieved through the pursuit of transit-oriented communities. Transit-oriented communities are those which preserve affordable housing near transit, reduce vehicle miles traveled (VMT) and improve access to quality transit infrastructure at an accessible price. Metro coordinates with other agencies in Greater Los Angeles to holistically address systemic barriers to safe, efficient and reliable transportation faced by low-income residents. These efforts reduce displacement risk for residents and enhance neighborhood stability. (Read more: Mobility Wallet Pilot Program)

Sustainability

In our pursuit of Sustainability, Metro strives to create an organizational culture and workforce that continually integrates sustainability principles into all aspects of decision-making and service execution, enhancing communities through mobility and opportunity access while mitigating LA County’s carbon footprint. (Read more: Sustainability – LA Metro).

Apply the Equity Indicators to Your Project

If you are completing a Metro equity assessment, evaluate the Equity Indicators in alignment with the instructions in these resources.

Review all the Equity Indicators below to help identify relevant equity considerations for your project. Metro’s Office of Equity and Race (OER) has identified suggested baseline Equity Indicators that apply to the widest range of projects. Metro staff and partners are also encouraged to review and evaluate additional Equity Indicators, particularly if their project scope or topic area may extend beyond the suggested baseline Equity Indicators.

Equity Indicators for your Equity Directional Assessment

To assess high-level equity implications of your project or initiative, Metro staff and consultants will evaluate the suggested baseline Equity Indicators when completing an Equity Directional Assessment. Metro staff and partners are encouraged to select OER’s suggested Baseline Equity Indicators when completing their Equity Directional Assessment: these Indicators are designed to cover a range of topics related to the relationship between mobility and equity. If staff determine Metro’s suggested baseline Equity Indicators do not adequately reflect the scope of their relevant project or initiative, they are encouraged to select alternate Equity Indicators from the full group of Equity Indicators (below).

Equity Indicators

Equity-Indicators-Accessibility

Accessibility

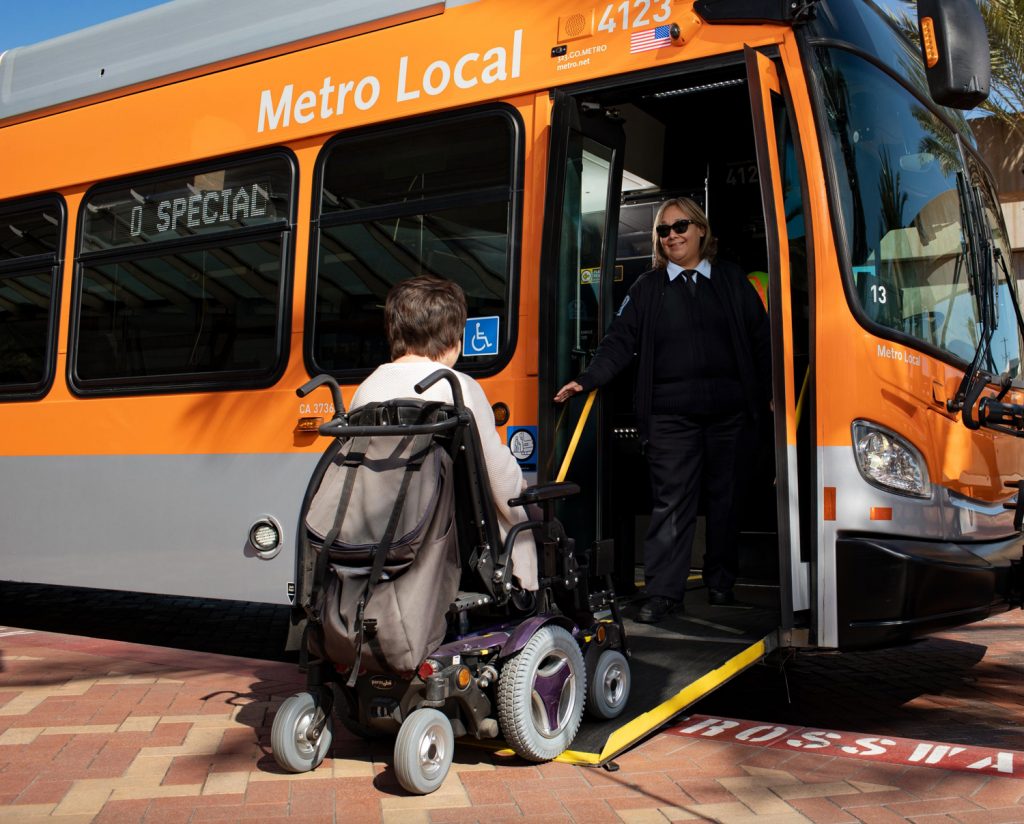
Suggested Baseline Indicator: Accessible transit provides safe mobility options for customers of varying priorities and abilities.

Read More
Equity-Indicators-Air-Quality

Air Quality

Suggested Baseline Indicator: Public transportation investments can contribute to improved air quality and support healthier communities.
Read More
Equity-Indicators-Commercial-Corridor-Vibrancy

Commercial Corridor Vibrancy

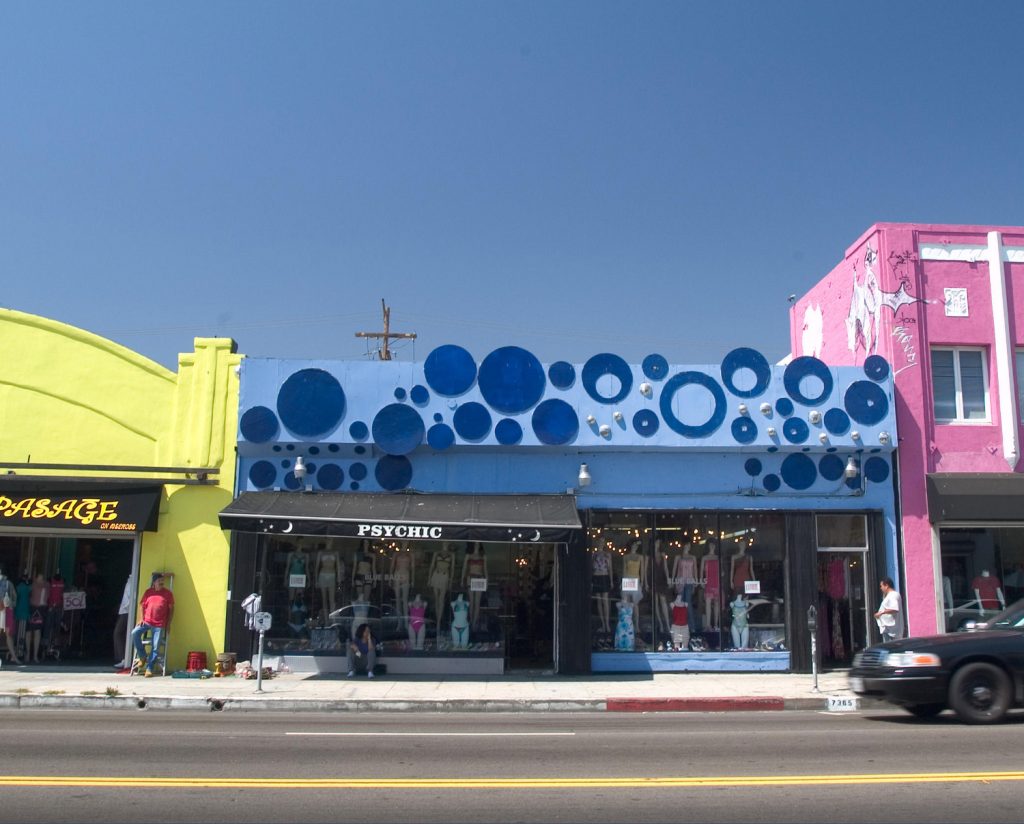
Suggested Baseline Indicator: Commercial corridor vibrancy measures the vitality and sustainability of local business districts that serve as economic anchors for communities.

Read More
Metro_Draft_Equity_Use_Data_and_Indicators_Landing_and_sub-pages_designs_new-indicators_neighborhood-change_v1

Neighborhood Change

Suggested Baseline Indicator: Public transportation investments can
accelerate resident displacement and heighten gentrification pressures.
Transportation planners should simultaneously address transit needs while preserving neighborhood affordability and stability.

Read More
Metro_Draft_Equity_Use_Data_and_Indicators_Landing_and_sub-pages_designs_new-indicators_equitable-procurement_v2

Equitable Procurement

Equitable procurement ensures that Metro’s capital investments include intentional pathways for small and disadvantaged business participation.

Read More
Equity-Indicators-Green-Space

Green Space

Public transportation enhancements can improve community member access to green space opportunities like parks and playgrounds, improving community health and quality of life.

Read More
Equity-Indicators-Neighborhood-Affordability

Neighborhood Affordability

Neighborhood affordability shapes where people are able to live in relation to transit. Aligning transportation services with affordable housing goals supports more efficient, equitable communities.


Read More
Equity-Indicators-Parking

Parking

Parking availability and infrastructure can affect how people move and use public transit facilities.

Read More
Equity-Indicators-Ridership

Ridership

Public transit ridership percentages and transit modes can measure how well a transportation network is meeting the diverse needs of community members.

Read More
Metro_Draft_Equity_Use_Data_and_Indicators_Landing_and_sub-pages_designs_new-indicators_small-business-neighborhood-servings-orgs-displacement_v1

Small Business and Organizational Displacement

⁠Commercial and organizational displacement resulting from transit investment can impact the social and economic fabric of communities. Preventing displacement ensures transportation investments protect organizations and support local economic activity—often before impacts are formally recognized or measured.

Read More
Equity-Indicators-UHI-Effect

Urban Heat Island (UHI) Effect

Dense, paved urban areas retain more heat which can affect comfort at transit stops, ridership and infrastructure integrity. Planning for shade and cooling can improve rider experience and system resilience.

Read More
Equity-Indicators-Walkability

Walkability

Walkable neighborhoods provide safe and easy access to transit options, employment, healthcare, education, recreation and other critical services.

Read More