


Personal Vehicle Use
Personal vehicle use refers to the use of a vehicle, often a private passenger automobile, for transportation. Personal vehicle use can enhance community members’ access to jobs, education, healthcare and other important amenities, which can be an important resource for Equity Focus Communities. However, personal vehicle use is not a substitute for high quality public and active transportation options. Personal vehicle use represents just one transportation mode in the larger transportation landscape and can complement other public transportation options in a transit network such as bus, rail and bikeshare. Understanding personal vehicle access and use can help Metro staff identify commuters and communities who may benefit from expanded public and active transportation infrastructure.
Understand your Datasets
Personal vehicle travel time and means can vary by location, income and other socioeconomic factors. By determining communities who experience particularly long commute times or personal vehicle dependence, planners can identify opportunities to advance transit-based solutions. Expanding quality public transit options can reduce traffic and commute times, which helps improve community members’ access to employment, education, recreation, and other important services and goods. Planners can reference resources like Caltrans Annual Average Daily Traffic (AADT) to estimate traffic patterns over time and evaluate community member preference for personal vehicles over public transit.
Example Datasets:
1. Means of Transportation to Work by Selected Characteristics for Workplace Geography (Table S0804): https://data.census.gov/table?q=s0804 (Data as polygons to be access through ArcGIS: https://services.arcgis.com/P3ePLMYs2RVChkJx/arcgis/rest/services/ACS_Means_of_Transportation_to_Work_Boundaries/FeatureServer)
2. Tenure by Vehicles Available (Table B25044): https://data.census.gov/table?q=b25044
3. Commuting Characteristics by Sex (Table S0801): https://data.census.gov/table?q=s0801
4. Caltrans Annual Average Daily Traffic (AADT) on State Highways: https://dot.ca.gov/programs/traffic-operations/census
5. Caltrans State Highway Lines: https://gis.data.ca.gov/datasets/77f2d7ba94e040a78bfbe36feb6279da_0/about
Instructions:
1-3. Filter for the appropriate area using the “Geographies” tab in the filter pane on the left side of the web page. Select all relevant geographies at the desired resolution. The highest resolution publicly available data are at the block group level.
- Table S0804 provides data on means of transportation by poverty status, race and ethnicity, citizenship, English proficiency and travel time.
- Data in Table B25044 includes number of vehicles available by housing unit types (owner-occupied or rented).
- Data in Table S0801 include means of transportation, time of departure to go to work, travel time to work and number of vehicles available.
Polygons at census tract level with the shapefile containing relevant commute data created in 2018 and updated in 2022.
Together, these datasets inform an area’s demographics, car ownership rates and commuting characteristics.
4-5. AADT is available in datasets for “all vehicles” and “trucks only” for all state highways in California. Download the most recent .xlsx files for updated traffic counts. To calculate traffic from “vehicles not including trucks,” subtract AADT for trucks only from AADT for all vehicles. Caltrans AADT is available for all vehicles and trucks from 2013 to 2022 (as of October 2024). Exported data can be joined to geospatial data using GIS software and the Caltrans State Highway Lines Shapefile to symbolize AADT.
Data Considerations: US Census Bureau data comes from the American Community Survey. Tract and block group data are updated annually in December of each year with a one-year lag. Current data (October 2024) cover the 2018 to 2022 period. Data in Table S0804 and Table S0801 are for workers 16 years and over who did not work from home. Data from Table B25044 are for occupied housing units.
Community Demographics Profiles Alignment
Travel Time by Transportation Mode
Transportation Mode by Race/Ethnicity
Households with no Access to a Vehicle
Explore the Index of Indicators in Metro’s Community Demographics Profiles Dashboard here.
Coordinate with Community Members
To understand how your project might impact personal vehicle use and commute times for community members, assess common commuting pain points, how they may influence employment opportunities and how enhanced public transit may alleviate burdens they experience. Consider implementing a commuting-specific survey to gain a broad understanding of community member experiences, commonly used transportation methods and acute transportation needs. Community member commute habits and personal vehicle use may be influenced by desired departure times, public transit network connectivity and efficiency and perceived safety using public transportation. It is crucial that planners seek to understand all contributors to personal vehicle use in the context of a particular community before and while pursuing a project.
Questions about this page’s vocabulary terms? Go to the Know the Vocabulary page
Wondering about relevant policies? Go to the Review the Relevant Policies page
Looking for engagement techniques? Go to the Engage Stakeholders page
Related Equity Indicators

Distance Traveled to Access High-Quality Transit
Suggested Baseline Indicator: Distances traveled to access high quality transit can be impacted by factors like service frequency, service reliability and safety.
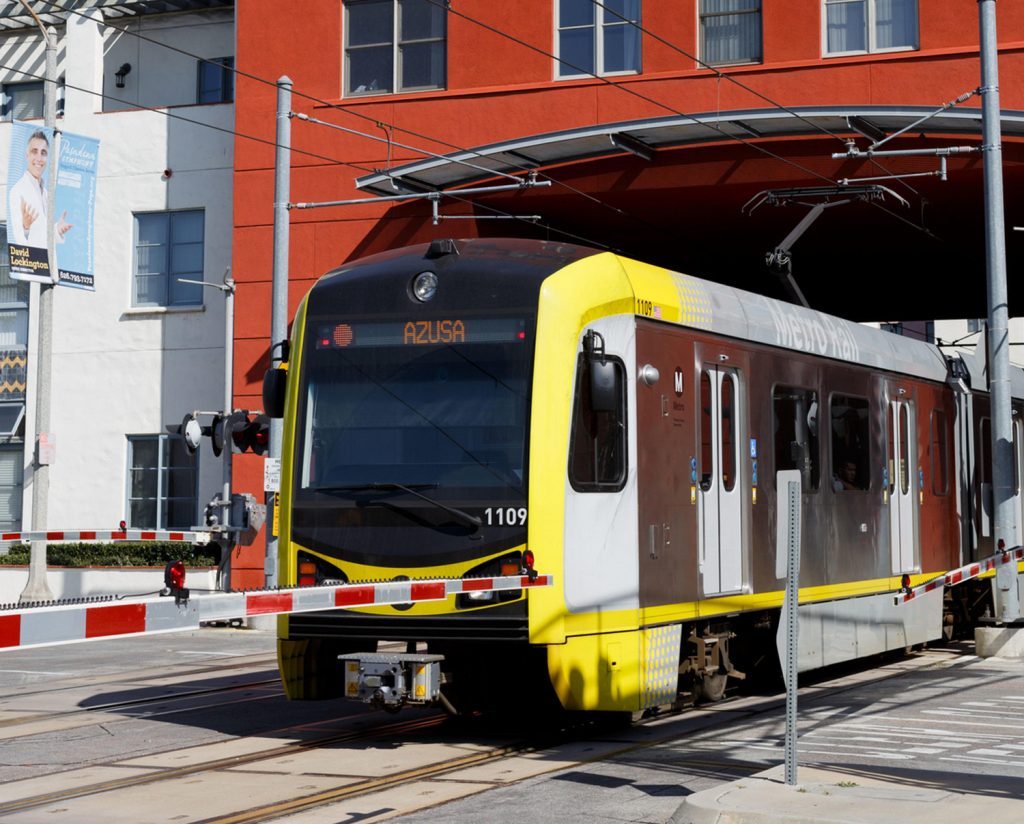
Public Transit Travel Time
Suggested Baseline Indicator: Public transit travel time can impact rider choices and their ability to use public transportation.

Ridership
Public transit ridership percentages and transit modes can measure how well a transportation network is meeting the diverse needs of community members.
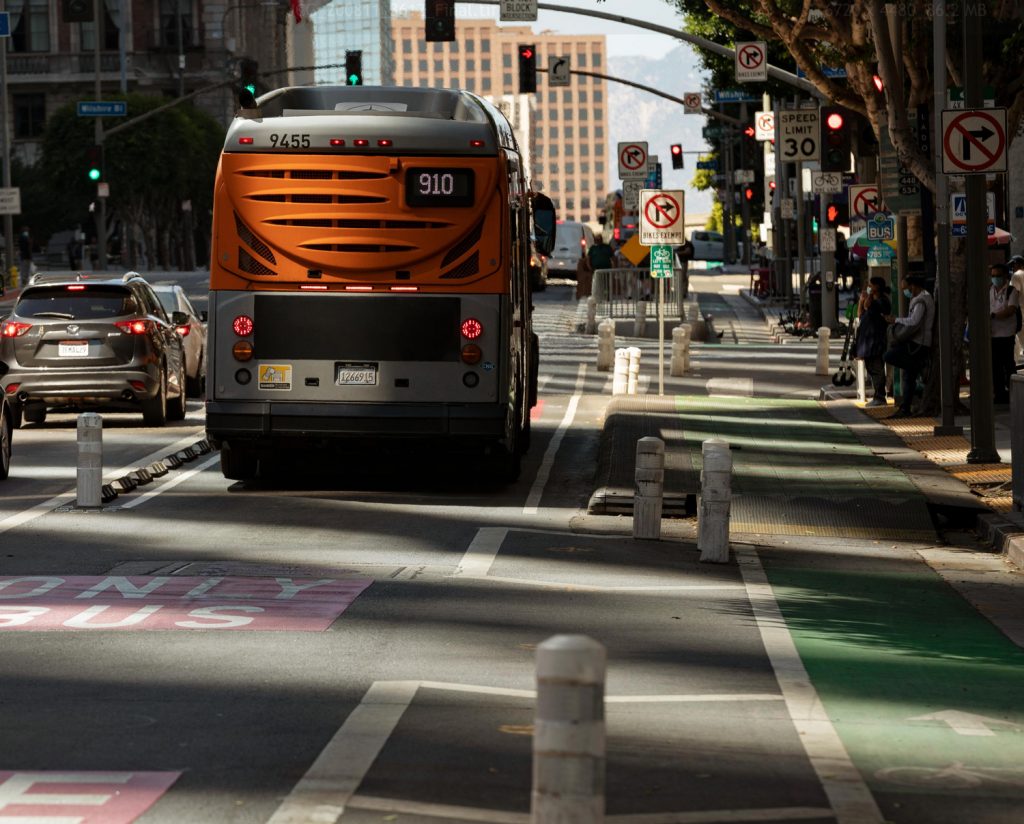
Transit Corridors
Investing in multi-modal transit corridors can simultaneously promote economic development and public transportation use.

Walkability
Walkable neighborhoods provide safe and easy access to transit options, employment, healthcare, education, recreation and other critical services.
