
Transit Resilience for Natural Hazards
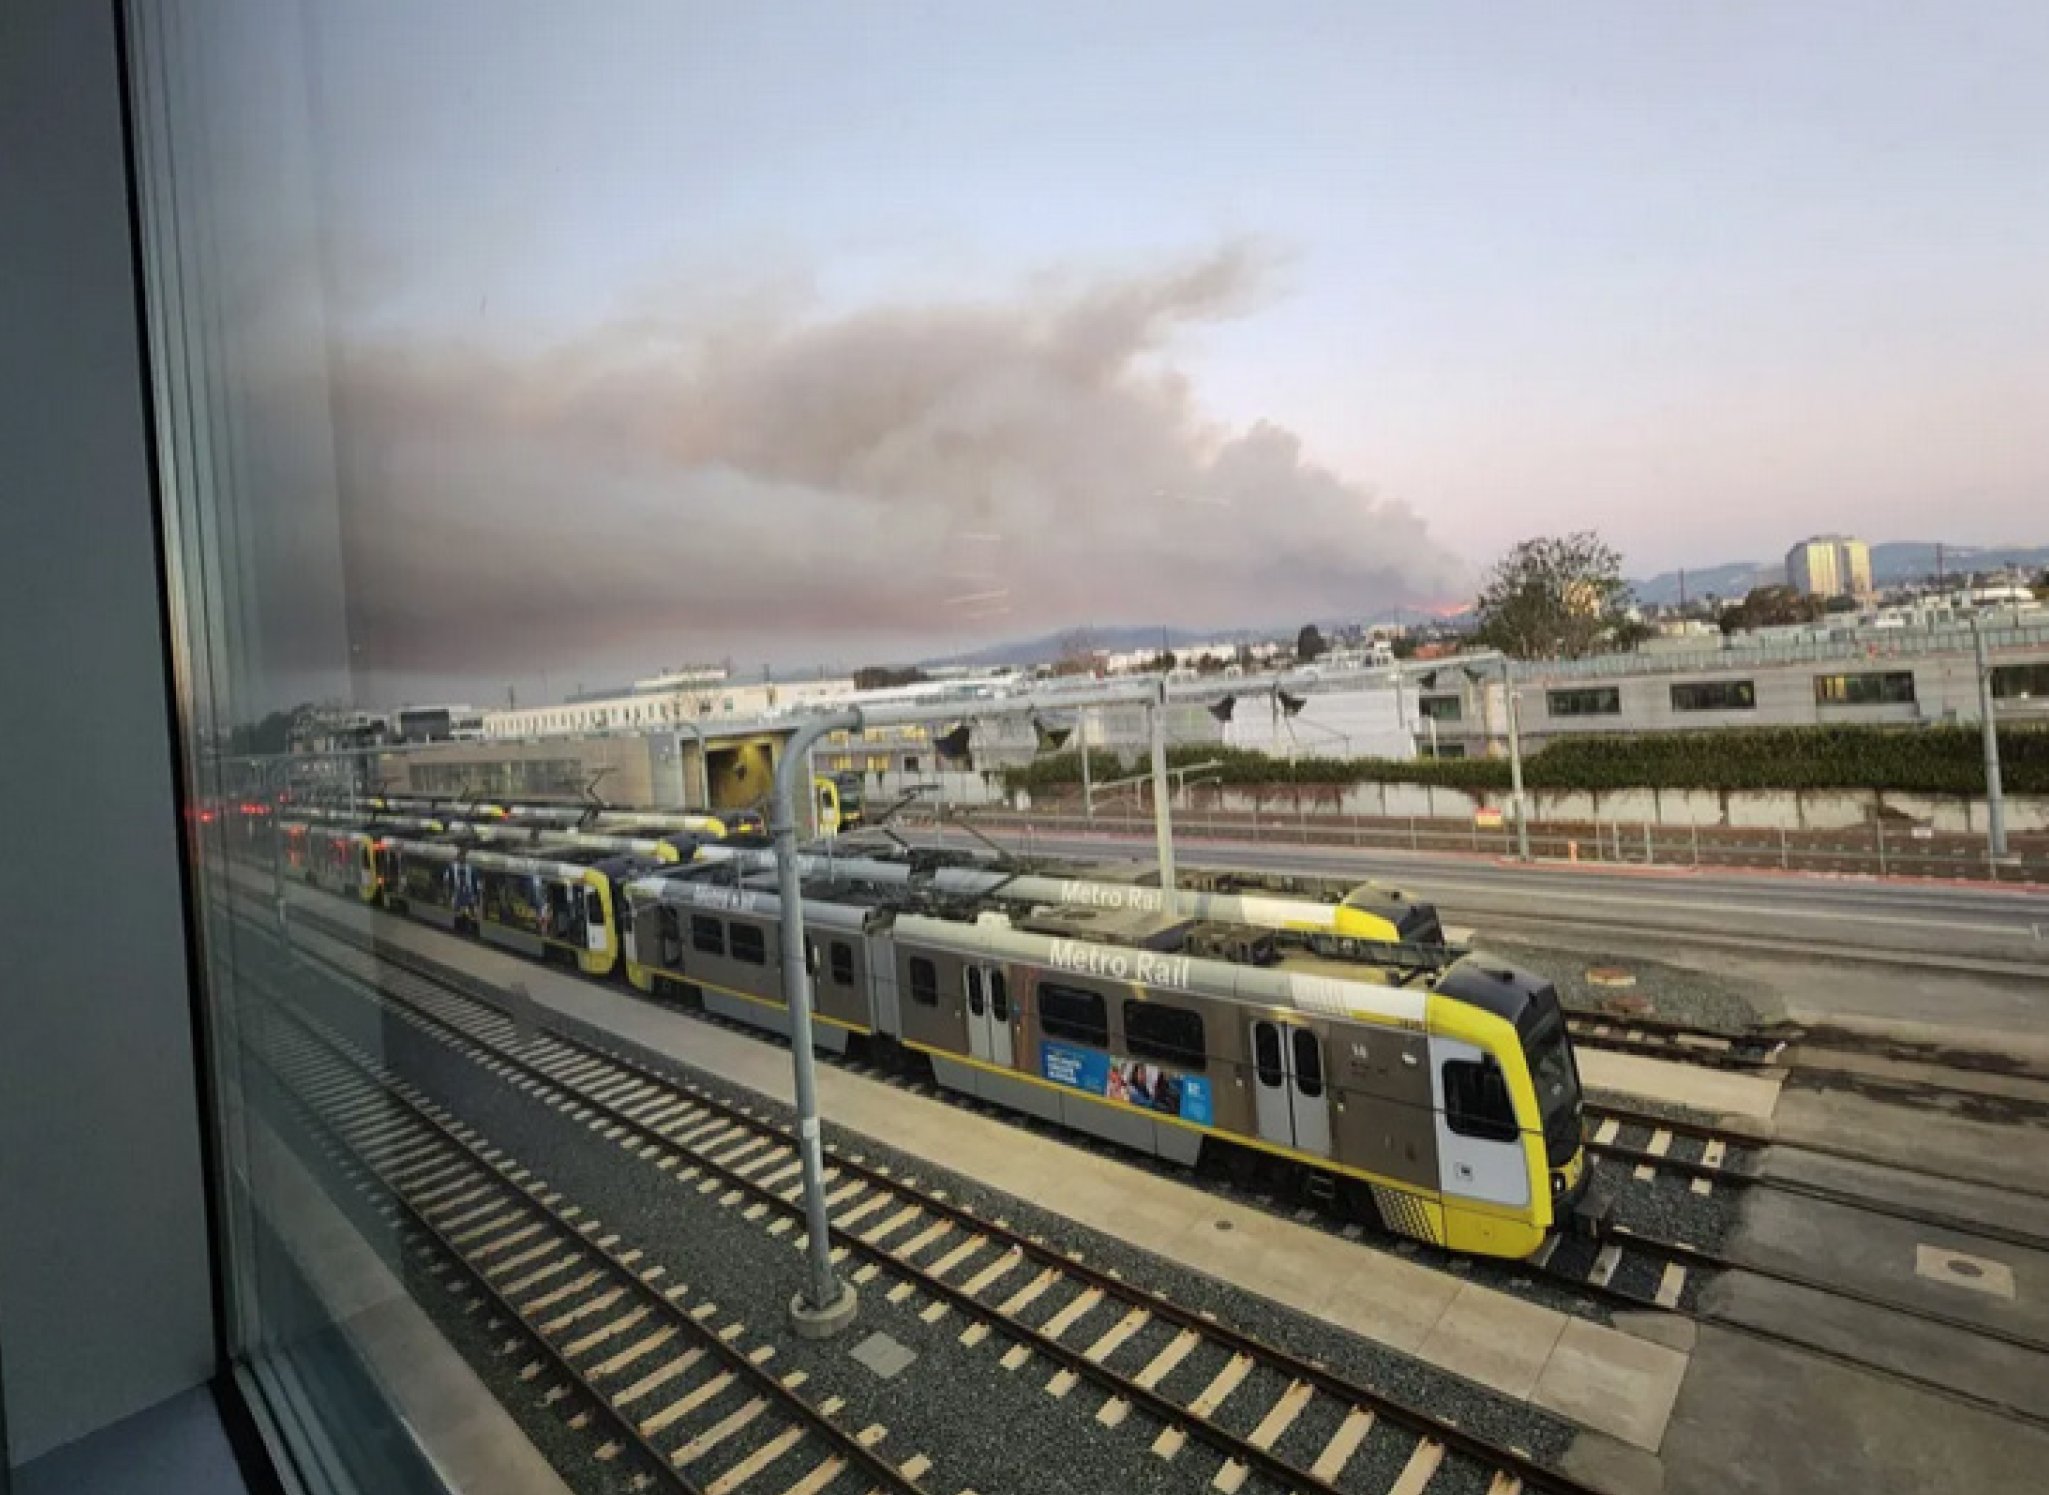
Natural hazards like extreme heat, earthquakes, flooding and wildfire can threaten social and physical infrastructure. The effects of climate change can exacerbate the impacts of these natural hazards and make emergency response and recovery more difficult. Natural hazards can disproportionately impact vulnerable populations—including low-income communities, BIPOC communities, young people, elderly people and people with disabilities—and lead to disruptions and displacement from homes and communities.
Transportation systems play a critical part in ensuring the safety and security of these communities and must remain adaptable, functional and effective during and after natural hazard impacts or natural disaster events. This is particularly important for residents in Equity Focus Communities, who are more likely to rely on public transportation for evacuations, essential services and recovery efforts.
This Indicator helps planners evaluate the extent to which a project or initiative supports transit systems in withstanding, adapting to and recovering from natural hazards. By reviewing relevant datasets, planners can gain insight into:
- Systemic and individual asset vulnerabilities
- Relevant emergency response capabilities
- Planning gaps that may disproportionately affect vulnerable populations
- Climate adaptation strategies for long-term project resilience and success
By considering climate change in the project planning process, planners can help foster a more resilient transit system that remains operational and adaptable during natural hazard events. Proactive measures planners can take to improve transit resilience include:
- Assessing site-specific climate-impacted natural hazards like extreme heat (see the Urban Heat Island Effect Indicator) and how these vulnerabilities may evolve over time
- Planning for transportation stress related to acute natural hazard events
- Testing for emergency management and effective evacuations
- Improving local disaster planning through coordinated response and recovery efforts
Understand Your Datasets
Due to LA County’s wide-ranging geography, Metro’s systems are exposed to varied natural hazards like extreme heat, wildfires, earthquakes and flooding. These climate-driven and climate-independent natural hazards continue to evolve and impact transit riders and infrastructure. The threat of wildfire in LA County is now year-round, for example, and Angelenos face growing risk of electrical outages. In response, planners can apply both historical natural hazard data and future-facing climate projections to plan for local contexts through targeted construction and management initiatives. Metro’s 2022 All-Hazards Mitigation Plan was developed as a tool to support infrastructure planning and improvements for climate resiliency. This Plan includes planning considerations for a broad range of climate change-driven natural hazards, as well as climate-independent hazards such as earthquakes.
Metro’s Natural Hazard Risks and Adaptation Options
Metro’s assets, staff and passengers face natural hazard-related risks. As shown in the table below, the agency’s 2019 Metro Climate Action and Adaptation Plan (CAAP) included a risk screening process to identify asset vulnerability to extreme heat, power grid outages, flooding and landslides/mudslides.
Asset categories at “highest risk” to each of the four top climate-impacted natural hazards to Metro (based on CAAP, 2019):
Increased Extreme Heat
- Subway
- Rail Stations
- Light Rail
- Local Central Business District
Increased Electric Grid Outages
- Rail Divisions
- Subway
- Bus Divisions
- Facilities-Other
Increased Riverine Flooding
- Rapid Buses
- Limited Express Buses
- Highways (for bus routes)
- Subways
Increased Land and Mudslides
- Limited Express Buses
- Rapid Buses
- Local Central Business District Buses
- Commuter and Circulator Buses
This risk screening analysis can help planners better understand how natural hazards may impact their projects and where to integrate asset-specific resilience measures.
During a natural hazard event, Metro’s assets—including its light rail, buses and subway system—can be exposed to extremely hot temperatures, flooding and power outages that can result structural and system damages, as well as service disruptions and staff and rider health impacts. To prepare for these events, planners can integrate flood and heat risk projections into project planning and build out contingency plans in the event of grid outages. According to each asset type, planners can also consider:
Light Rail
- Enhancing inspection and maintenance protocols
- Installing cooling for traction power substation train control systems
- Implementing speed guidelines and restrictions, as well as enhanced train/staff schedule management
- Operationalizing contingency plans, safety protocols and training, as well as implementing access to cooling mechanisms to protect workers and passengers
Subway System
- Upgrading for efficient HVAC and air circulation equipment
- Enhancing the maintenance and inspection of equipment systems like HVAC, air circulation and drainage
Bus
- Upgrading buses to include heat resistant material and air conditioning units
- Implementing hazard notification systems for bus drivers, as well as providing additional resources such as emergency driver training, speed restrictions, re-routing, interval schedules, elevating traffic signals and proactive traffic management
A list of strategies to reduce risks due to extreme heat and power outages is available in the 2025 Metro Climate Action and Adaptation Update.
In addition to asset-specific impacts and mitigation measures, planners may consider emergency preparedness at the rider level and develop a community-focused understanding of natural hazard impacts. Using the datasets below, planners can assess how natural hazards affect vulnerable communities and apply learnings from previous events to improve preparedness. In the case of large capital infrastructure projects or geographically diverse systems, planners may decide to conduct a multi-hazard risk assessment to further understand current natural hazard risks and how these may evolve in the future.
Example Datasets:
1. Planning for Preparedness for People with Disabilities and Other Access and Functional Needs:
1 a. https://www.nationalacademies.org/read/22669/chapter/1#v
1 b. http://www.ready.gov/individuals-access-functional-needs
Instructions:
1a. The Transportation Research Board has published research that provides guidance, strategies, tools and resources for paratransit service providers to improve emergency preparedness, response and recovery. The effort documents literature review and expert interview results and presents a “lessons-learned” matrix of key findings, effective practices and their applicability to paratransit operations for planners to evaluate project planning against.
1b. This government resource for people with disabilities provides useful considerations for emergencies and disaster planning. Planners’ awareness of general and disability-specific circumstances and needs can support effective planning and protocol development for emergency situations, accounting for diverse communities for planners to evaluate and consider in project planning.
Data Considerations: Review these resources in the context of how emergency response systems can be stress tested to improve efficacy during a disaster. Consider how transit projects support connectivity to critical care such as hospitals and shelters in disaster settings. Inform planning considerations by using this resource in conjunction with census data (see “Accessibility” Indicator).
2. Transit Planning for Preparedness: Transit Agencies and Wildfire Evacuation
2a. https://www.its.ucla.edu/publication/transit-riders-evacuation-2025-la-fires/
2b. https://hazards.colorado.edu/weather-ready-research/transit-agencies-and-wildfire-evacuation
Instructions: These studies provide important considerations for transit planning in the face of wildfire risk, as well as the role local transit agencies play in supporting transit-dependent and vulnerable populations in emergency settings.
2a. Review Evacuation Patterns, Health Risks, and Mobility Strategies Among Transit Riders in the 2025 L.A. Fires by focusing on the “Key Research Findings” section for evacuation modes by subgroups, evacuation time and health impacts to inform targeted transit support. Further review the “Conclusions and Recommendations” section to align project planning with the recommendations provided for transit agencies in California.
2b. Review the Case Study of the 2021 Caldor Fire, considering the “Literature Review” section for anticipating vulnerabilities during evacuations, assessing current project preparedness against the findings in the “Challenges of Transit and Paratransit Evacuation in Tahoe Wildfire Planning and Response” section and aligning initiatives with the recommendations in the “Conclusions” section.
Data Considerations: In response to January 2025 Los Angeles wildfires, the first policy brief resource highlights key findings from a survey conducted through the Transit app in February 2025, collected among transit riders who did and did not evacuate. By centering the experiences of Los Angeles’ transit-riding populations amid unprecedented wildfire smoke and mobility disruptions, the findings offer evidence to inform equitable, health‑conscious emergency and evacuation planning.
3. Climate Mapping for Resilience & Adaptation: https://resilience.climate.gov/
Instructions: Navigate to the “Get Started” page and review the video or written tutorial. Explore the “Understand Exposure” section which may allow users to create a snapshot of how Metro assets, staff and passengers are currently affected by relevant climate hazards to the region, as well as how this may evolve under future climate scenarios. Each of the suggested tools below have specific guidance on use and application.
a. Climate Mapping for Resilience and Adaptation (CMRA)
b. Sea Level Rise Viewer
c. The Climate Explorer
d. Wildfire Risk to Communities
Data Considerations: This dataset hosts a suite of over 500 tools and data sources which can be filtered by hazard or asset type and range from case-specific adaptation workbooks to hazard comprehensive mapping and projection tools. Dataset use can be adapted based on a given research goal but can provide a baseline understanding of current and future climate exposures. Major storms, extreme heat and wildfires have been identified as significant hazards through Metro’s 2022 All-Hazards Mitigation Plan and may be primary focus areas for screening. Following an exposure analysis, this dataset hosts resources to help planners understand vulnerability and risk, investigate adaptation options, prioritize and plan and take action on implementing climate risk mitigation strategies through the creation of a Climate Vulnerability Assessment or adaptation plan.
Community Demographics Profiles Alignment
CalTrans Equity Index
Population by Age and Sex
Older Adults and People with Disabilities
Low Income Households
Households with no Access to a Vehicle
BIPOC Population
Equity Focus Communities
Explore the Index of Indicators in Metro’s Community Demographics Profiles Dashboard here.
Metro has coordinated several programs to address mobility needs for critical populations during disaster recovery. In the wake of the January 2025 Southern California Wildfires, Metro expanded its LIFE Program eligibility to victims of the wildfires and partnered with FEMA-activated resource centers, the Pasadena Convention Center, the Red Cross, Kaiser Permanente and other organizations to enroll over 6,700 new participants. Metro created a specialized adaptation of its Mobility Wallet pilot program by providing Emergency Mobility Wallets (EMW) for residents impacted by the fires. For more information on Metro’s emergency wildfire response efforts, click here.

Coordinate with Community Members
The datasets above support planners in prioritizing infrastructure upgrades, developing targeted emergency response strategies that address the needs of vulnerable populations and aligning transit planning with broader natural disaster preparedness and climate adaptation goals. The suggested quantitative datasets should inform project planning in close collaboration with community input on the lived experience of natural hazards and the lasting influences of natural disasters. Impacted community members are the best equipped to highlight existing gaps where there is a need for transit support during and after a disaster event. Alongside evaluating assets, staff and passenger-specific project impacts, planners should align with Metro and local emergency management guidelines and prepare to support transit-dependent and vulnerable populations during and after natural hazard events. In addition to short-term physical impacts and impacts from the loss of public transit, there is a heightened risk of social displacement and gentrification in more vulnerable communities following disasters, as investors may exploit disaster survivors through post-disaster real estate speculation (see the Neighborhood Change Indicator). With community input, planners can develop contingency plans for restoring transit services after disasters, identify critical transit corridors and partner with emergency management agencies to improve mobility during recovery efforts.
Consider interviews, community surveys and strong CBO partnerships to identify community members’ barriers to transportation and lived experiences during emergencies, as well as to develop solutions that align with community needs and priorities. CBOs, as trusted community resources, are often the first point of support for residents during disasters and can play a pivotal role in disaster recovery by distributing essential aid and connecting community members to services. Metro partners with CBOs during emergency events to expand access to key programs, such as CBO-led registration for the LIFE Program during the January 2025 Southern California Wildfires.
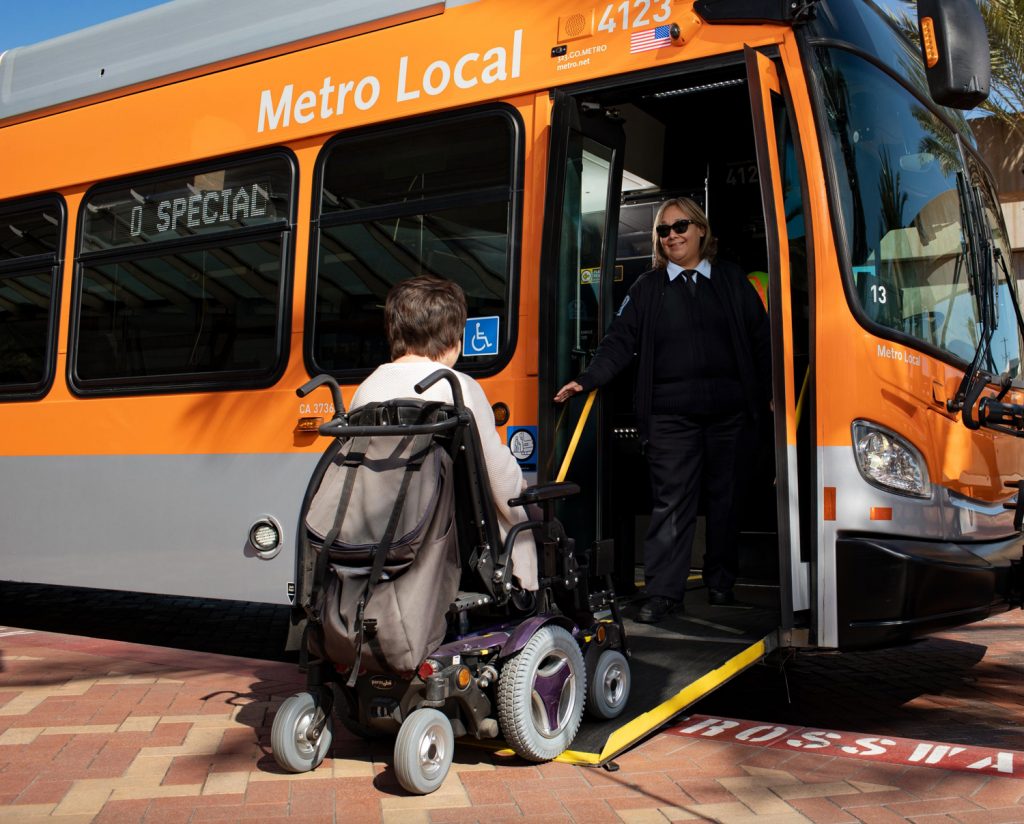
Elderly populations, families with young children, unhoused populations, groups facing language barriers and climate-burdened communities are historically underrepresented in community engagement efforts. Paratransit users should be key demographic groups in community engagement efforts as there is often insufficient resources for their evacuation during emergencies, as shown in this resource from the Example Datasets above. Allocate resources toward reaching these groups to ensure engagement efforts include a range of perspectives.
Questions about this page’s vocabulary terms? Go to the Know the Vocabulary page
Wondering about relevant policies? Go to the Review the Relevant Policies page
Looking for engagement techniques? Go to the Engage Stakeholders page
Related Equity Indicators
Accessibility
Suggested Baseline Indicator: Accessible transit provides safe mobility options for customers of varying priorities and abilities.

Distance Traveled to Access High-Quality Transit
Suggested Baseline Indicator: Distances traveled to access high quality transit can be impacted by factors like service frequency, service reliability and safety.

Personal Vehicle Use
Suggested Baseline Indicator: Personal vehicle-use patterns can inform opportunities for public transit enhancement projects.


Urban Heat Island (UHI) Effect
Dense, paved urban areas retain more heat which can affect comfort at transit stops, ridership and infrastructure integrity. Planning for shade and cooling can improve rider experience and system resilience.

Walkability
Walkable neighborhoods provide safe and easy access to transit options, employment, healthcare, education, recreation and other critical services.