Green Space
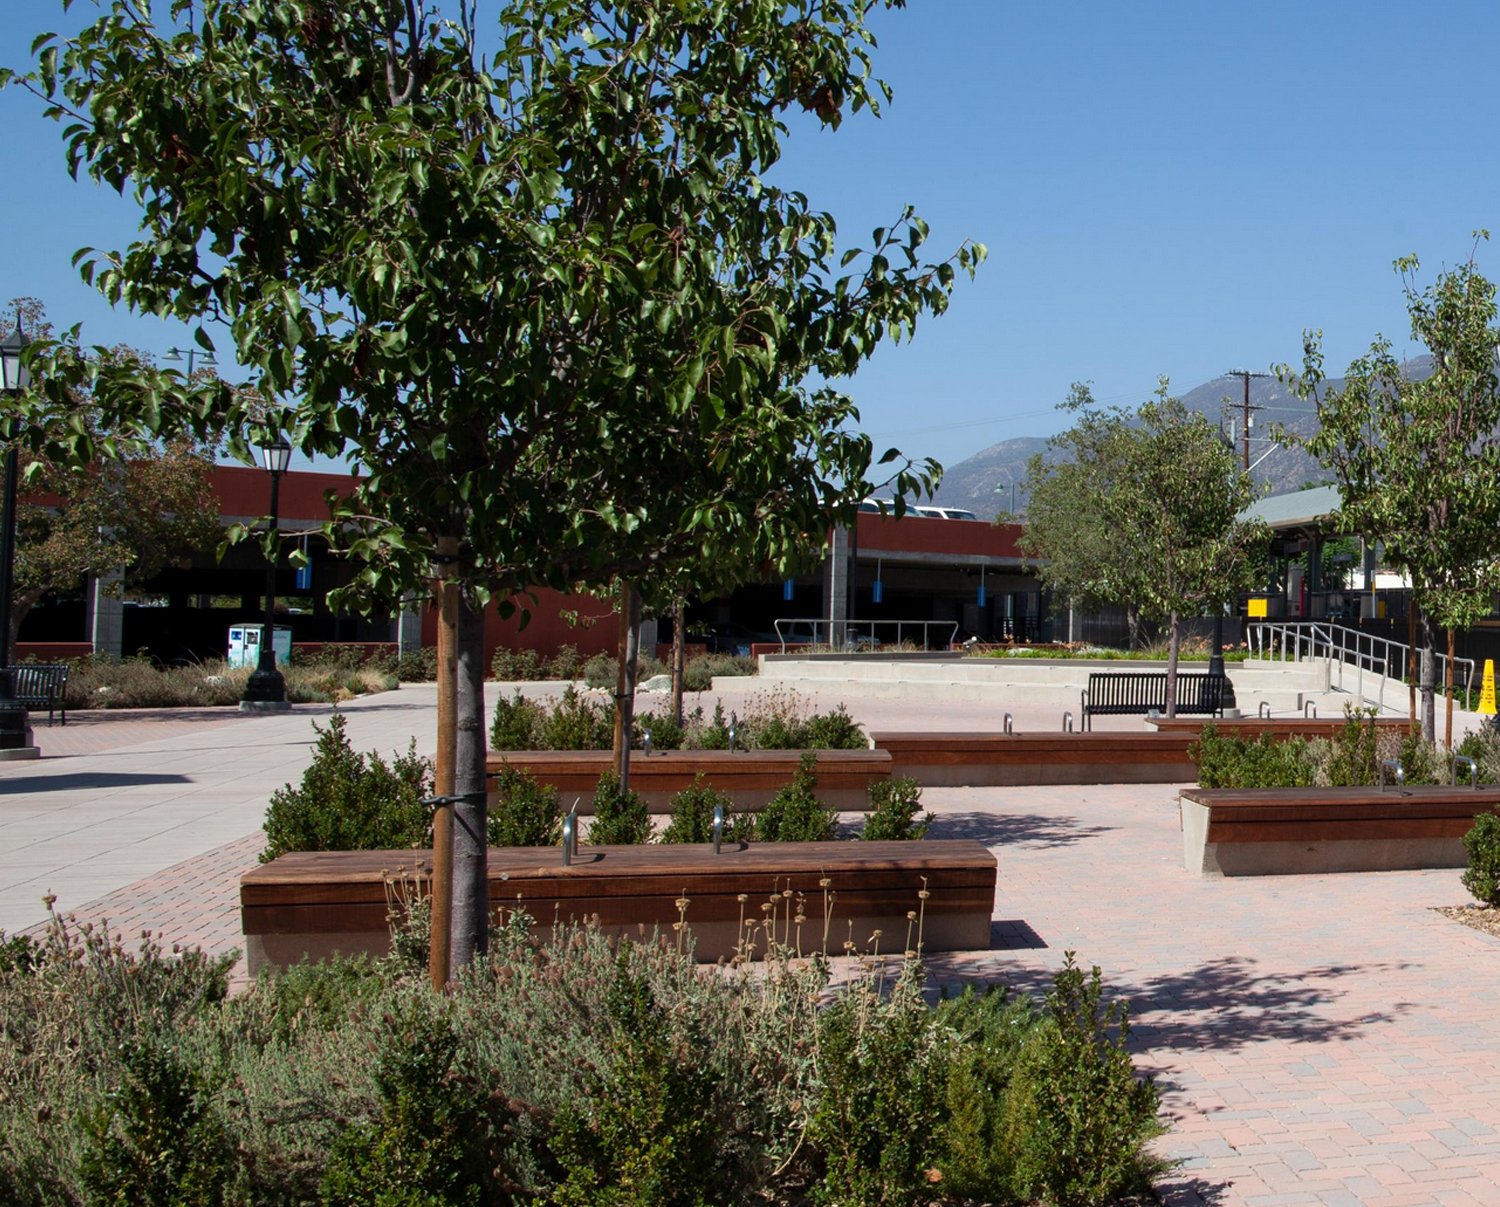
In the context of transportation and land use planning, green space refers to open areas with vegetation and other natural features in an otherwise urban environment. Green space can refer to, but is not limited to, public parks, gardens, trails, rivers, forested or tree canopy-rich areas, playgrounds and landscaped community and cultural centers. Green space provides numerous benefits to communities, including improved air quality, shade and cooling effects, groundwater capture, biodiversity enhancement and social and recreational opportunities. Green space is often associated with transit-oriented development (TOD), which can promote green space provision for urban residents through integrated mobility and green space infrastructure in urban areas.
Understand Your Datasets: Data can help you assess community member proximity to green space and how existing green spaces align with community needs. Green space accessibility is often measured by green space distance from residential areas: green spaces within a half-mile radius of a home (a 10–15-minute walking distance) are generally considered accessible. Measuring green space accessibility can indicate how much a community is able to experience the health and environmental benefits of green space. Green space can further be evaluated according to size, recreational opportunities and programming, biodiversity, maintenance and alignment with community priorities. Green space can also be evaluated through remote sensing techniques like LiDAR (Light Detection and Randing) technology, which can provide a technical assessment of the features of urban landscapes.
Example Datasets:
1. USGS Protected Areas Database (PAD-US): Protected Areas | U.S. Geological Survey
Instructions: Open the online web map and locate area of interest. Assess proximity to boundaries of Public Access Areas, including parks, playgrounds and other publicly managed recreational outdoor spaces. Federal, state and locally owned spaces are included in the database. Popular mapping applications can provide estimated walking times from various locations to green space.
Data Considerations: PAD-US version 4.0 was published in April 2024 from data (typically, shapefiles or geodatabase feature classes) provided by land management agencies.
(See also: https://www.usgs.gov/programs/gap-analysis-project/science/pad-us-data-overview)
2. LA County Tree Inventory: https://treepeople.org/los-angeles-county-tree-canopy-map-viewer/
Instructions: By zooming in/out, users can explore tree canopy cover at various geographic units, including parcel, census tract, ZIP code and city level. Details about existing and possible tree cover are available by clicking within the map.
Data Considerations: The web map viewer shows the Existing and Possible Tree Canopy Coverage in Los Angeles County (from the parcel to the city level). Possible Tree Canopy refers to areas that are theoretically available for tree canopy expansion.
3. Los Angeles Countywide Comprehensive Parks and Recreation Needs Assessment: https://rposd.lacounty.gov/park-needs-assessment/
Instructions : Refer to the Park Needs Assessment Map Viewer to explore park needs throughout Los Angeles. Users can also reference the County’s Enterprise GIS site to access all data generated as part of the Assessment. Users can also read the final Park Needs Assessment Report PDF to learn more about the Assessment, its methodology and its results.
Data Considerations: Los Angeles Countywide Comprehensive Parks and Recreation Needs Assessment evaluates existing parks and recreation facilities throughout Los Angeles County to determine the scope, scale and locations of neighborhood park improvement needs in Los Angeles County.
4. LA Metro Transit to Parks Strategic Plan: https://transit2parks-lametro.hub.arcgis.com/
Instructions: The “Data” tab houses a set of documents and datasets to supplement the overall strategic plan. These materials include relevant stations, routes, service areas and LA Countywide Comprehensive Parks and Recreation Needs Assessment results. Metro staff may consult with all applicable resources to better understand how their project may support green space conservation and expansion.
Data Considerations: Consult this Metro resource to better understand how your project may align with Metro’s vision for increasing access to parks and open space countywide, particularly for Equity Focus Communities.
Community Demographics Profiles Alignment
CalEnviroScreen Score
Healthy Places Index
Schools

Explore the Index of Indicators in Metro’s Community Demographics Profiles Dashboard here.
Coordinate with Community Members
Supplement geographic green space assessment with community-based research, such as an experience survey, or personal interviews in local green spaces to identify and understand communities’ priorities, experience, and use of green spaces. Different communities may value different aspects of green space, ranging from unprogrammed grassy or forested areas to playgrounds, sports fields and community centers. Take steps to understand what your project community values in nearby green spaces and how your project could influence or enhance these priorities. Transportation planning projects can provide opportunities to strengthen communities’ access and connection to green spaces; however, they can also introduce risks of green gentrification where local residents become priced out of neighborhoods when green space amenities are improved. Collaborate with local stakeholders and policymakers to consider anti-displacement measures, such as rent stabilization and inclusionary zoning requirements.
Questions about this page’s vocabulary terms? Go to the Know the Vocabulary page
Wondering about relevant policies? Go to the Review the Relevant Policies page
Looking for engagement techniques? Go to the Engage Stakeholders page
Related Equity Indicators

Active Transportation Infrastructure
Suggested Baseline Indicator: Active transportation infrastructure supports safe walking, cycling, rolling and access to public transit.

Air Quality
Suggested Baseline Indicator: Public transportation investments can contribute to improved air quality and support healthier communities.

Urban Heat Island (UHI) Effect
Dense, paved urban areas retain more heat which can affect comfort at transit stops, ridership and infrastructure integrity. Planning for shade and cooling can improve rider experience and system resilience.

Walkability
Walkable neighborhoods provide safe and easy access to transit options, employment, healthcare, education, recreation and other critical services.