
Small Business and Organizational Displacement
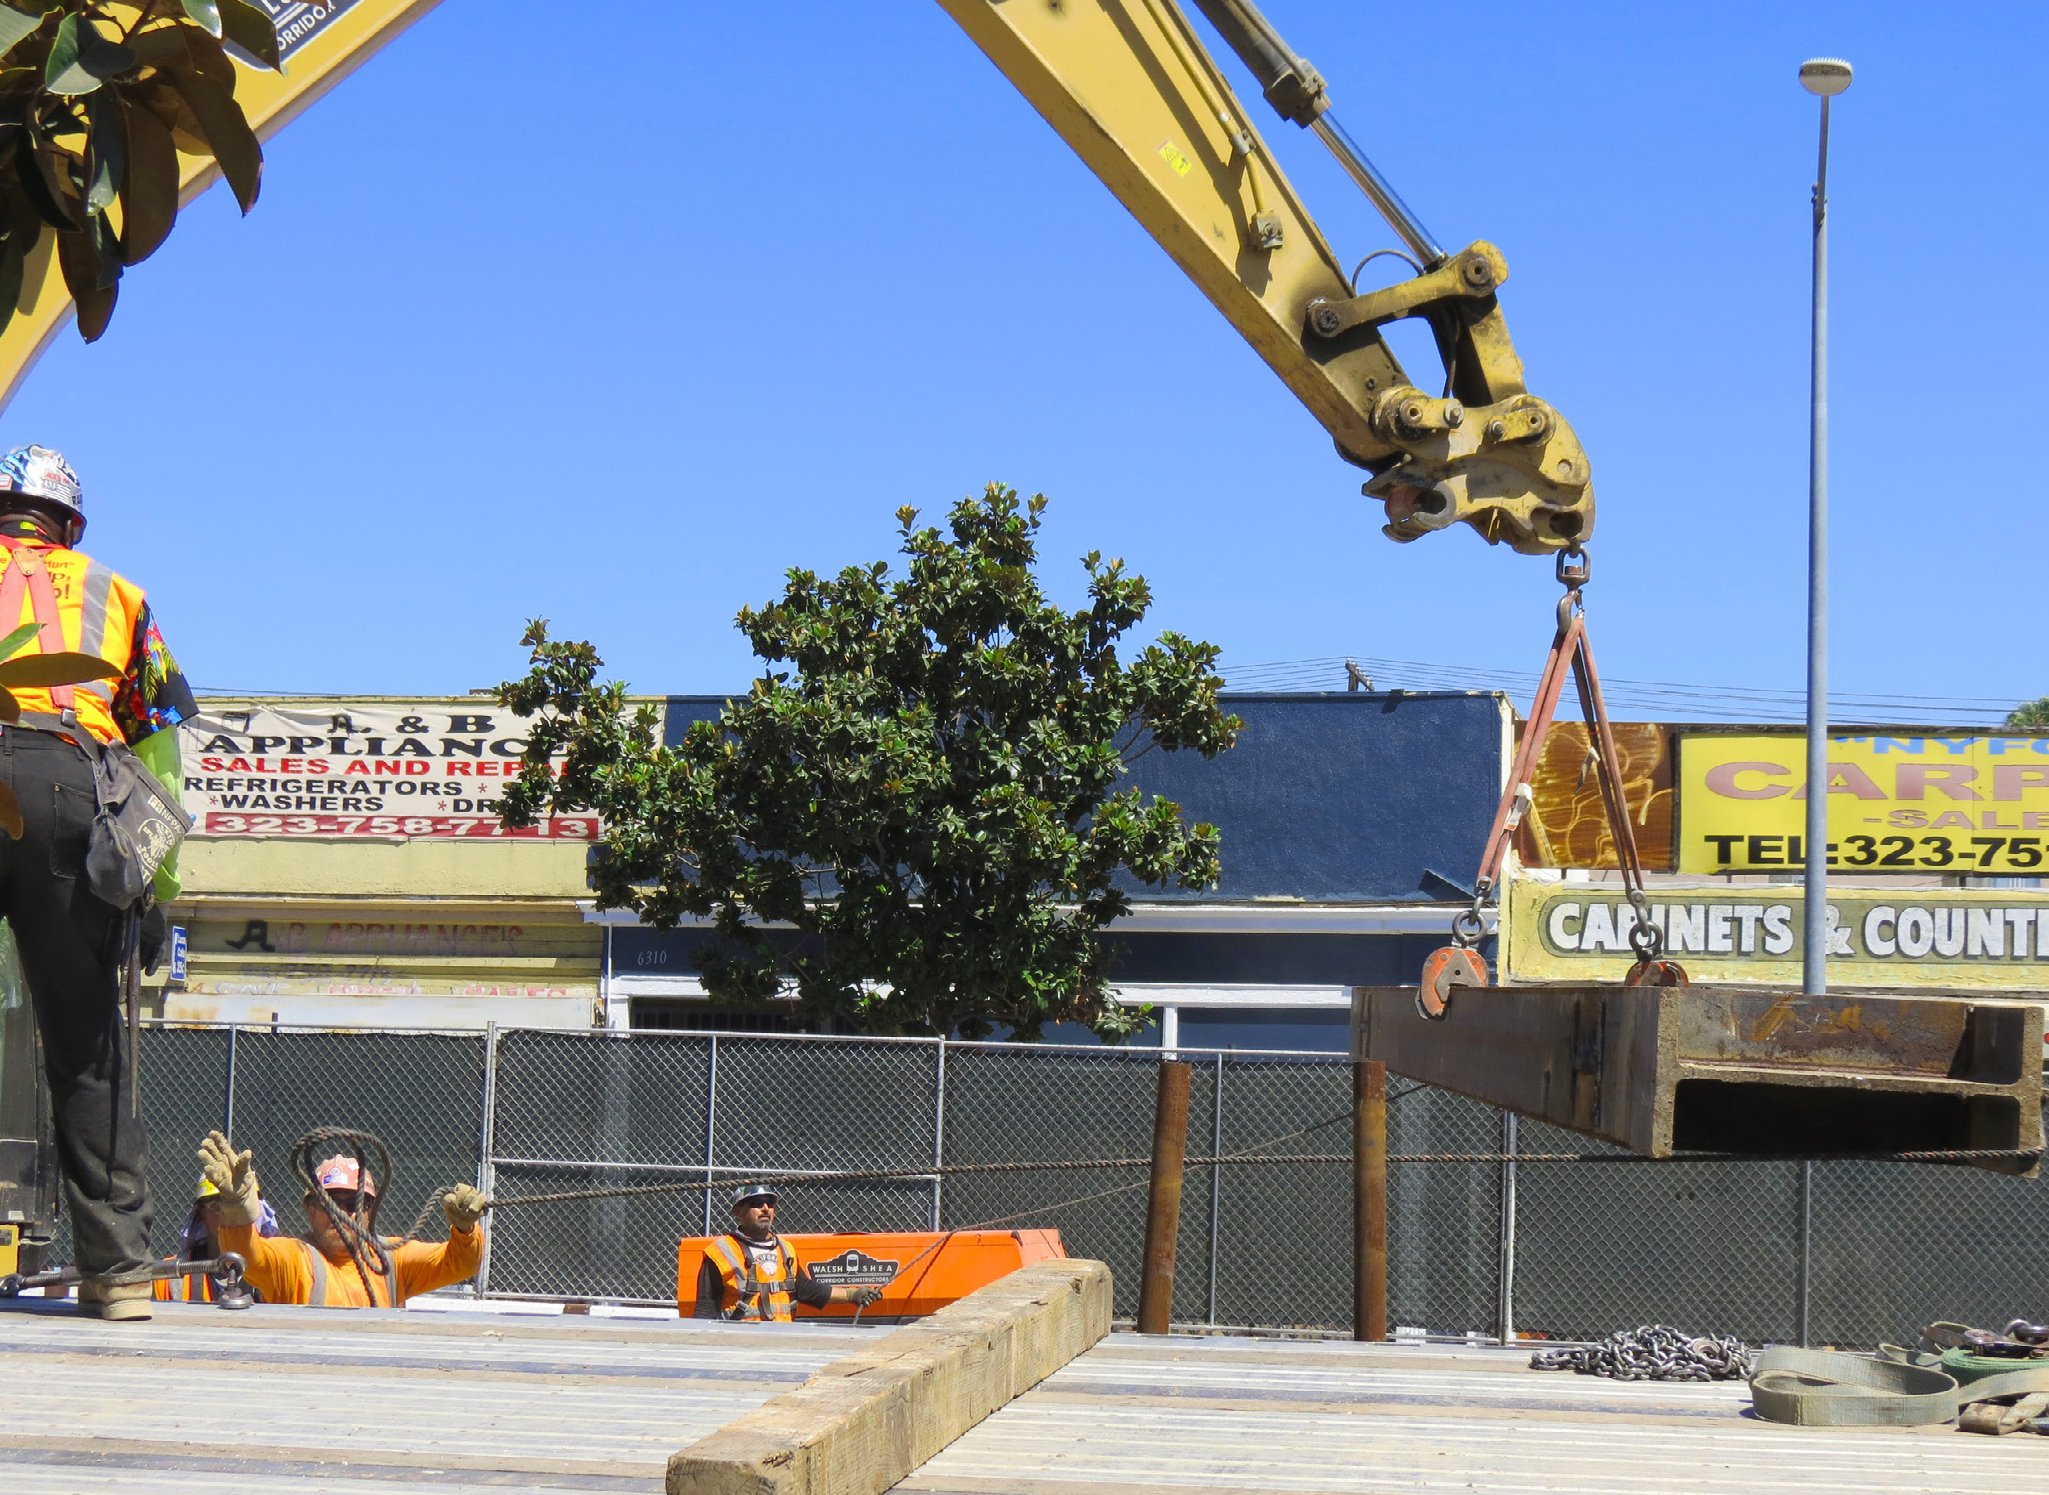
Transit investments can trigger rent escalation, redevelopment pressure and extended construction disruption that force small businesses and community-serving nonprofits—including clinics, childcare providers, faith institutions and social service agencies—out of corridors and neighborhoods near transit improvements. Unlike residential displacement, which is tracked through housing data and subject to tenant protection frameworks, commercial and organizational displacement occurs with fewer legal protections and lower visibility in standard planning datasets. Yet these losses can be equally destabilizing, threatening the community anchors that low-income residents depend on for essential services, cultural identity and local economic participation.
This indicator is distinct from the Neighborhood Affordability Indicator, which focuses on residential cost burden and housing stability. Small business and organizational displacement often precedes residential displacement and may accelerate it by removing the services, employers and social infrastructure that make a neighborhood livable and affordable for long-term residents. Because commercial leases typically offer shorter terms and fewer protections than residential leases, displacement can occur rapidly and with little recourse. Capturing this dynamic requires dedicated measurement separate from housing-focused indicators.
Understand Your Datasets
Measuring small business and organizational displacement requires tracking business presence, tenure and turnover over time—both before and after transit projects are announced and constructed. The most reliable baseline data comes from business license registries, commercial property records and longitudinal business databases. The City of Los Angeles Office of Finance Business Tax Registration data and LA County business license records provide local establishment counts that can be analyzed by corridor and over time. The U.S. Census Bureau’s County Business Patterns (CBP) and ZIP Code Business Patterns provide annual establishment counts by industry sector and geography, enabling trend analysis.
Commercial real estate data from sources like CoStar, LoopNet and the LA County Assessor’s Office provide insight into lease rates, vacancy trends and ownership changes that signal displacement pressure. Rising commercial rents and declining vacancy rates near transit stations are early indicators of risk, particularly for businesses on short-term or month-to-month leases. Property ownership transfers, especially from local individual owners to institutional investors or developers, can indicate speculative activity that precedes displacement.
Displacement of neighborhood-serving organizations, including nonprofits, community health centers, faith institutions, childcare providers and social service agencies, is difficult to capture through commercial real estate data alone, as those datasets track space rather than the community function the occupant serves. The NCCS Address Metadata Table from the Urban Institute’s National Center for Charitable Statistics offers a practical solution: it geocodes all nonprofit addresses in the IRS Business Master File to the census tract and block level, allowing planners to map the full landscape of nonprofits operating within a project corridor without individually researching organizations. Filtering by NTEE (National Taxonomy of Exempt Entities) classification codes allows planners to prioritize the organization types most vulnerable to displacement and most critical to community resilience. Quantitative mapping through NCCS should be paired with direct qualitative outreach in the project’s target community as organizational leaders typically know well before lease expiration that they cannot afford to remain, and that knowledge rarely surfaces in any database.
Example Datasets:
1. City of LA Office of Finance — Business Tax Registration: https://finance.lacity.gov/open-data-portal-published-information
Instructions: Access the City’s business tax registration database to identify active and lapsed business registrations by geographic area. Filter by address ranges within transit project corridors. Track registration counts over time to identify patterns of business entry and exit. Cross-reference with transit project timelines to assess correlation between project announcements, construction periods and business closures.
Data Considerations: Business tax registration data captures legally operating businesses but may lag in recording actual closures. Informal businesses and sole proprietors may not be consistently represented. Use in combination with field surveys to validate findings.
2. CoStar / LoopNet — Commercial Real Estate Market Data: https://www.costar.com/
Instructions: Access CoStar through agency subscriptions or use the public-facing LoopNet platform to review commercial vacancy rates, asking rents and lease transaction data for corridors near transit projects. Use historical filters to assess rent trends before and after transit investment announcements. Identify corridors where asking rent prices have increased more than 15-20% over a three-year period as elevated displacement risk zones.
Data Considerations: CoStar data is most comprehensive for larger commercial properties. Coverage of small storefronts and informal commercial spaces may be limited. Supplement with field surveys and conversations with local commercial real estate brokers familiar with the corridor.
3. NCCS Address Metadata Table — National Center for Charitable Statistics: https://nccs.urban.org/nccs/datasets/metadata-address/
Instructions: Download the NCCS Address Metadata Table from the Urban Institute’s NCCS data portal. The table contains geocoded addresses for all nonprofits in the Unified Business Master File (BMF), mapped to census state, county, tract and block level using the Urban Institute’s geocoder. Filter by county (Los Angeles) and cross-reference nonprofit addresses against transit project corridor geographies using the provided census tract identifiers. This allows planners to identify the density and types of nonprofits operating within a project corridor without looking up organizations individually. Append census demographic data using the provided crosswalks to understand the communities these organizations serve. Use organization type codes (NTEE classifications) to filter for community-serving categories most relevant to displacement risk: human services, health, education, arts/culture and religious organizations. This dataset identifies where nonprofits are located, not whether they are at displacement risk: pair with qualitative outreach to assess lease status and organizational vulnerability.
Data Considerations: The table is geocoded from IRS 990 filings, so address quality varies—smaller organizations and those using PO Box addresses will have lower geocoder match scores. The table includes a match score field; filter for higher-confidence matches when conducting corridor-level analysis. Data reflects the most recently filed BMF address and may lag in identifying actual location for organizations that have already relocated.
4. U.S. Census Bureau — County Business Patterns: https://www.census.gov/programs-surveys/cbp.html
Instructions: Use Census Bureau’s County Business Patterns or ZIP Code Business Patterns to track establishment counts by NAICS industry code over time in project-adjacent ZIP codes. Filter for industry sectors particularly vulnerable to displacement—food service, personal care services, childcare, health services and cultural/arts establishments. Compare establishment counts 3-5 years before and after transit project milestones.
Data Considerations: CBP suppresses data for small geographies where disclosure would identify individual employers. Use ZIP code-level data where tract-level is suppressed. CBP also does not capture sole proprietors without paid employees.
5. LA County Assessor — Commercial Property Records: https://assessor.lacounty.gov
Instructions: Use the LA County Assessor’s property search to track ownership changes for commercial parcels in transit project corridors. Identify recent sales and reassessments that may signal speculative acquisition. Cross-reference with project timelines to detect pre-announcement land speculation. Flag parcels that have transferred from individual/small LLC ownership to institutional ownership as higher displacement risk.
Data Considerations: Ownership transfer data reflects recorded transactions and may not capture beneficial ownership through complex LLC structures. Combine with CoStar data for a more complete picture of commercial real estate activity.
Community Demographics Profiles Alignment
Employment by Industry
Caltrans Equity Index
Median Household Income
Unemployment Rate by Race/Ethnicity
Renter Households
Low-Income Households
BIPOC Population
Equity Focus Communities
Explore the Index of Indicators in Metro’s Community Demographics Profiles Dashboard here.
The information on this page is presented through a Small Business and Organizational Displacement lens. For other perspectives on this subject, visit: Neighborhood Affordability, Employment Opportunities and Job Preservation, Transit Corridors, Commercial Corridor Vibrancy, Neighborhood Change.

Coordinate with Community Members
Engage with local merchant associations, business improvement districts (BIDs) and chambers of commerce early—ideally before project design is finalized—to understand existing business conditions and owner concerns about transit impacts. Partner with CBOs and other key stakeholders, such as Community Development Financial Institutions (CDFIs) and small business technical assistance providers operating in the project corridor, as they often have direct relationships with vulnerable businesses and early knowledge of financial stress or lease uncertainty.
Engage nonprofit and social service organization leaders separately from for-profit businesses, as their displacement calculus and available resources differ significantly. These organizations often serve the same communities Metro seeks to benefit through transit investment, and their displacement can undermine those goals directly.
Coordinate early with Metro’s Business Interruption Fund (BIF) program. Metro’s BIF provides financial assistance to small businesses along Metro construction corridors and has been deployed on prior projects including the Crenshaw/LAX, Regional Connector and D Line Extension alignments. Planners should flag project corridors with high small business density for BIF program consideration at the earliest feasible project stage—well before construction begins—so that program eligibility criteria and outreach infrastructure can be established proactively rather than reactively. Coordinate with Metro’s Construction Mitigation team to align corridor-level business engagement with BIF program timelines. Continue meeting regularly with internal and external stakeholders throughout the project. Following project completion, engage subject matter experts to track anti-displacement metrics and monitor small business and organizational dynamics over time.
Questions about this page’s vocabulary terms? Go to the Know the Vocabulary page
Wondering about relevant policies? Go to the Review the Relevant Policies page
Looking for engagement techniques? Go to the Engage Stakeholders page
Related Equity Indicators

Commercial Corridor Vibrancy
Suggested Baseline Indicator: Commercial corridor vibrancy measures the vitality and sustainability of local business districts that serve as economic anchors for communities.

Employment Opportunities and Job Preservation
Employment opportunities and job preservation ensure that transportation investments support local economic opportunities and protect existing employment for community members.

Neighborhood Affordability
Neighborhood affordability shapes where people are able to live in relation to transit. Aligning transportation services with affordable housing goals supports more efficient, equitable communities.

Neighborhood Change
Suggested Baseline Indicator: Public transportation investments can accelerate resident displacement and heighten gentrification pressures. Transportation planners should simultaneously address transit needs while preserving neighborhood affordability and stability.

Walkability
Walkable neighborhoods provide safe and easy access to transit options, employment, healthcare, education, recreation and other critical services.