
Access to Essential Health Care Services

Transportation is a documented social driver of health. Research consistently shows that people who lack reliable access to transit are more likely to delay or forego essential medical care, miss appointments and experience poorer health outcomes. Transit-dependent riders often navigate within geographically dispersed systems of care, including hospitals, outpatient clinics, rehabilitation centers, reproductive clinics, referrals across specialists, pharmacies, laboratories and health education while balancing work and caregiving responsibilities. This cumulative travel burden falls disproportionately on low-income residents, women, people of color, individuals with disabilities and others in Equity Focus Communities (EFCs). Geographical coverage of public transit and its proximity to health care services are important health care accessibility factors but are not the only considerations. Accessibility encompasses fare affordability and rider safety—both while riding public transit and while waiting at a Metro stop—and access to reliable, current communications related to schedule changes and delays to avoid missing appointments.
In Los Angeles County, car-centric infrastructure and geographically dispersed health care facilities create significant barriers to essential health care access for transit-dependent riders. A survey conducted by Black Women for Wellness across their membership found that access to these services is not solely determined by the physical presence of health care facilities, but also by whether transportation systems enable people to affordably, reliably and autonomously reach care without disproportionate burdens. Riders additionally identified safety during trips to be a key concern, both during busy and potentially congested commutes as well as early mornings and late nights. Access to sanitary restrooms was another concern, as pregnant riders, the elderly, people with disabilities or riders with young children may be limited by access to clean public restrooms along a route. Metro is actively addressing this challenge through initiatives like the Throne restroom program, which maps safe, clean and free-to-use restrooms, including Throne units, on the Metro system. In these ways, Metro works to incorporate safety and comfort considerations into planning processes.
Transportation planning should account for cumulative travel burden rather than isolated health care trips. Metro planners can assess and improve commute times and incorporate digital timetables, text alerts for delays, tap-to-pay options and internet access at Metro stops and on buses to make health care access safer and more reliable. Determining community priorities and listening to rider concerns allows planners to address health care accessibility in a holistic and comprehensive manner. By incorporating health care access into transportation planning and analysis, Metro planners can help identify service gaps and prioritize investments to meet people where they are and make measurable progress toward equitable health outcomes for all Angelenos.
Understand Your Datasets
Planners can evaluate access to essential health and wellness services like hospitals, clinics, pediatric health care and reproductive health care by combining demographic data, facility location data and transit network performance data.
Demographic Data for Consideration
Population Age: Residents of different ages may have specialized health care needs. These needs range from pediatrics for youth to long-term care and rehabilitation for elder riders. Another critical population age is residents ages 15–49, who represent the core group for many reproductive health services. Planners can map the geographic distribution of key population ages to identify neighborhoods where transit investment to support specific types of health care access is most critical.
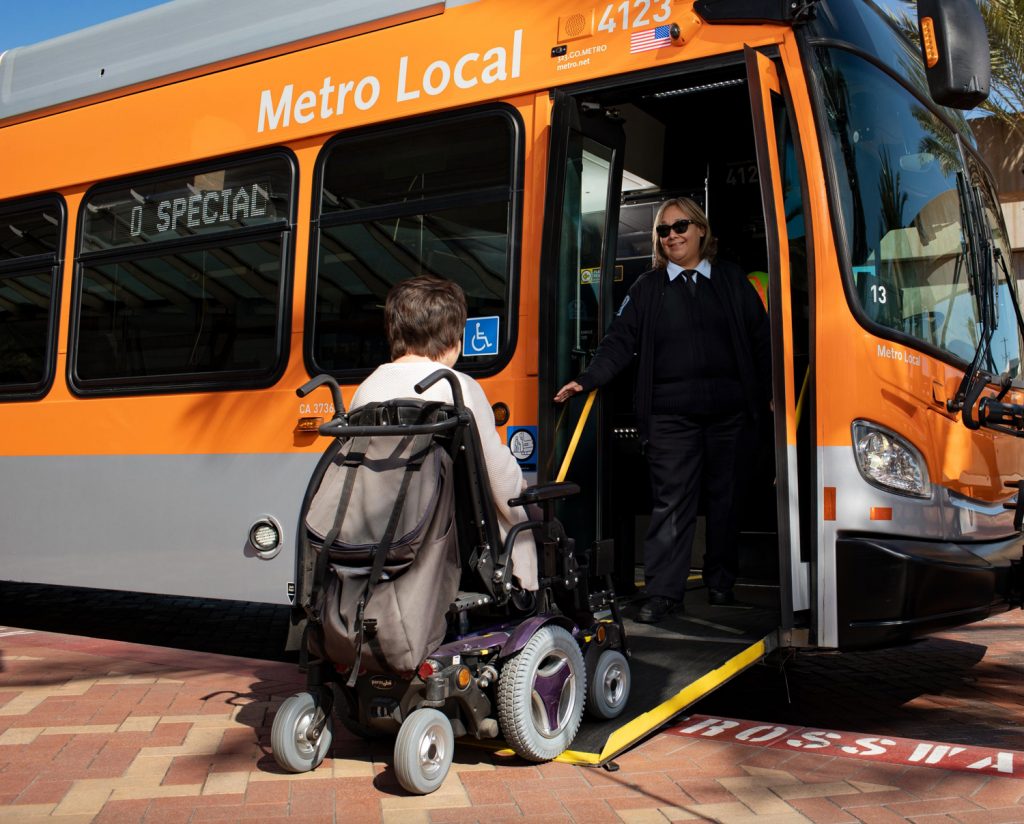
Disability: Individuals with disabilities often face unique challenges in accessing both general and specialized health care, often requiring more frequent appointments, further travel distances to receive specialized care and the need for accessible transit options. Planners should not only look at overall disability metrics but also look at the breakdown or specific subcategories of disability data such as mobility, cognitive, hearing or visual impairments. In addition, planners should conduct Barrier Analyses to identify and address physical and environmental obstacles, such as lack of sidewalks, steep slopes or inadequate lighting, that impede access to transit stops. Incorporating census data on disability status and type, along with community engagement, can help identify areas of need and ensure transit systems are designed to accommodate diverse mobility requirements.
Single-Parent Households and Single Mothers: Single-parent households—particularly single mothers—face compounded transportation challenges when accessing prenatal, postnatal and pediatric care while managing childcare and work schedules. Census data on family structure and poverty status can identify concentrated areas of need.
Gender: Health care needs vary across all genders, including transgender and nonbinary individuals, and all of these needs should be considered in the planning process. Access to the full range of reproductive health services includes health care education, family planning, contraception, prenatal and postnatal care, fertility services, STI testing and treatment, abortion care, hormone therapy and gender-affirming care. Planners should consider the distribution of gender-diverse populations, including through surveys and community engagement, when assessing access gaps.
In 2019, Metro released a study called “Understanding How Women Travel” that identifies the mobility barriers and challenges that women face. This study activates five primary data collection methodologies to fill gaps in existing datasets and connect with core transit rider groups that may be difficult to reach through conventional methods. The study provides key insights into travel and transit behavior, safety, access, reliability, convenience and comfort which Metro can use to enhance the quality of the travel experience for women in LA County.
Race/Ethnicity: Many BIPOC communities experience disproportionate burdens of chronic disease and overlapping health-related vulnerabilities. These burdens are shaped by structural inequities such as unequal access to preventive care, healthy food, safe environments, stable housing and culturally responsive health services. For example, Black and Indigenous communities experience significantly higher rates of maternal mortality, making transit access to maternal care providers particularly urgent for these communities.
Income and Insurance Status: Low-income residents are more likely to rely on publicly funded reproductive health providers (Federally Qualified Health Centers (FQCSs), Planned Parenthood, Department of Health and Social Care (DHS) clinics) and on public transit. Income data can help planners identify communities where transit access to safety-net care providers is most critical.
Households Without a Vehicle: Residents without personal vehicle access are most dependent on the transit network to reach any destination, including health care providers. For more information, integrate regional census data, visit the Personal Vehicle Use Equity Indicator and explore Metro’s EFC Map.
Limited English Proficiency: Language barriers can compound transportation barriers when accessing health services. Understanding the linguistic diversity of communities near proposed transit improvements can support both service planning and outreach for health programs. See Metro’s resources on Limited English Proficiency stakeholder engagement to learn more.
Source of Usual Health Care: Residents who report having a regular health care provider or a place for routine medical care are better positioned for early detection, treatment and management of chronic disease. Having a source of usual health care when one is sick or needs care is associated with an increased likelihood of receiving preventive screenings and services.
The datasets below are organized around understanding who needs care, where care is located, whether transit connects people to care and what barriers exist to access care.
Example Datasets:
1. HRSA Build Your Own Map: https://data.hrsa.gov/tools/build-your-own-map/
Instructions: Select and plot health centers, grants and other agencies’ data on the map as separate data layers. Import data from the web or upload a CSV file. Click the “Getting Started” button to review instructions. To find a data set(s) to plot, planners can use the search box for a specific dataset or browse through the categories and sub-topics. To add layers to the map: Check the box next to the dataset that you want displayed on the map. Additional datasets may be added thereafter. Use one of the selection tools to draw an area of interest on the map to explore details of the selected dataset and generate a table for export.
Data Considerations: HRSA provides several relevant data layers including types of HRSA supported facilities, types of services/clinicians, shortage areas, HRSA awarded grants and gender and poverty demographics. The site also hosts data on Health Professional Shortage Areas (HPSA) and Maternal Care Target Areas (MCTA), as well as provides an HRSA Maternal and Infant Health Mapping Tool.
2. California Health Interview Survey (CHIS): https://healthpolicy.ucla.edu/our-work/california-health-interview-survey-chis/access-chis-data
Instructions: Log in to access the AskCHIS™ tool, an online data query system that allows planners to search for health statistics at the county, region and state level. For specific topics or survey questions, planners may choose to check the Survey Topics List for each survey year. You can also check the questionnaires tab to see every variable that is available based on information collected via the Questionnaires.
Data Considerations: Collected by CHIS and UCLA Center for Health Policy Research, CHIS has a broad range of publicly available web tools and data in addition to confidential datasets that can be accessed through an application. Suggested health data variables include the “Access to and Use of Health Care” group of questions, including “Usual Source of Care,” which can be helpful for understanding who is not connected to health care services or a primary care provider, as well as “Difficulty accessing care, tests, treatment” and “Caregiving.”
3. LA County DPH Community Health Profiles — Transportation & Health Indicators: https://ph-lacounty.hub.arcgis.com/pages/chp
Instructions: Pick a geography of interest to launch the interactive web map in a new tab (i.e., LA County). Using the navigation bar on the left pick a theme, such as Healthcare Access, Perinatal and Infant Health, HIV and Other Sexually Transmitted Infections, and add relevant data layers to the map. Available layers include Medically Underserved Areas/Populations, Adults with Difficulty Obtaining Needed Medical Care, Adults with Medi-Cal and First Trimester Prenatal Care Initiation. Planners can additionally access data reports for communities in LA County.
Data Considerations: The Los Angeles County Department of Public Health’s Community Health Profiles data initiative provides local-level data for over 100 indicators known to impact community health and wellbeing, organized under 11 thematic areas. Data are provided for 179 places in Los Angeles County with population sizes of 20,000 or greater and are intended to support efforts to improve health and community conditions across Los Angeles County.
4. Census Data by Topic (Health): https://data.census.gov/table?t=Health
Instructions: Filter for the appropriate area using the “Geographies” tab in the filter pane on the left side of the web page. Select all relevant geographies at the desired resolution. The highest resolution publicly available data are at the block group level. In the filter pane, under Topics, choose Health and/or Fertility for a series of data tables including Selected Characteristics of Health Insurance Coverage, Age by Disability Status, Sex by Age by Vision, Hearing, Cognitive, or Ambulatory Difficulty or Women 15-50 Who Had a Birth in the Past 12 Months by Marital Status.
Data Considerations: US Census Bureau data from the American Community Survey. Tract and block group data are updated annually in December of each year with a one-year lag. Current data (2024) cover the 2020-2024 ACS 5-Year estimates. This data is available broken down by Age, Race/Ethnicity, Poverty Status, Labor Force Status, Educational Attainment and Public Assistance Income.
5. Medicare Provider Locator: https://www.medicare.gov/care-compare/
Instructions: Navigate to the relevant provider type (e.g., Doctors & clinicians, Hospitals) and enter project address or zip code to locate Medicare providers.
Data Considerations: Understanding Medicare providers in the area supports the design of routes and schedules that prioritize accessibility and reduce barriers to essential health care services for vulnerable populations, such as seniors and individuals with disabilities, who often rely on public transit to reach medical services.
6. UCLA Health — Reproductive Health Datasets: https://www.uclahealth.org/programs/womens-health/education-and-research-center/maternal-child-health-datasets
Instructions: Planners may review available datasets linked from this resource. Relevant sources include the California Health Interview Survey, LA HealthDataNow!, L.A. HOPE’s Health Overview of a Pregnancy Event, Los Angeles County Health Survey, Los Angeles Mommy and Baby (LAMB) Project and Maternal and Infant Health Assessment.
Data Considerations: Methodology, data granularity and availability for download varies by dataset and host. Planners can navigate individual website links to review the available data for the project area.
Community Demographics Profiles Alignment
Caltrans Equity Index
Median Household Income
Low-Income Households
BIPOC Population
Equity Focus Communities
Explore the Index of Indicators in Metro’s Community Demographics Profiles Dashboard here.

Coordinate with Community Members
Supplement geographic analysis of demographic distribution with community-based research to understand how LA County’s transportation system affects access to health care. Health needs—including mental health care, pediatric care, long-term disease treatment, prenatal care, family planning, abortion and gender-affirming care—are deeply personal and community engagement should be conducted with respect, confidentiality and cultural sensitivity.
The determining factors for equitable access to essential health and wellness resources like reproductive health care can differ significantly between communities depending on the specific needs and concerns of residents. It is essential to determine the unique accessibility concerns of each community affected by transportation projects. Consider open houses, community surveys and strong partnerships with community-based organizations (CBOs) that work directly in specialized health access including pediatric health, geriatric health, reproductive health, maternal health and gender equity to identify specific barriers and co-develop transit improvements that address them.
Ensure public engagement campaigns are conducted in accessible formats and include translation services. Populations historically underrepresented in community engagement —including undocumented residents, transgender and nonbinary individuals and people experiencing housing instability—may face the greatest barriers to health care access and should be prioritized in outreach efforts.
Questions about this page’s vocabulary terms? Go to the Know the Vocabulary page
Wondering about relevant policies? Go to the Review the Relevant Policies page
Looking for engagement techniques? Go to the Engage Stakeholders page
Related Equity Indicators
Accessibility
Suggested Baseline Indicator: Accessible transit provides safe mobility options for customers of varying priorities and abilities.

Air Quality
Suggested Baseline Indicator: Public transportation investments can contribute to improved air quality and support healthier communities.

Distance Traveled to Access High-Quality Transit
Suggested Baseline Indicator: Distances traveled to access high quality transit can be impacted by factors like service frequency, service reliability and safety.

Food Security and Accessibility
Public transportation investments can support access to healthy, affordable and culturally appropriate food, which is a fundamental social determinant of health.

Personal Vehicle Use
Suggested Baseline Indicator: Personal vehicle-use patterns can inform opportunities for public transit enhancement projects.

Urban Heat Island (UHI) Effect
Dense, paved urban areas retain more heat which can affect comfort at transit stops, ridership and infrastructure integrity. Planning for shade and cooling can improve rider experience and system resilience.

Walkability
Walkable neighborhoods provide safe and easy access to transit options, employment, healthcare, education, recreation and other critical services.