
Public Transit Dependency in a Car Dependent County
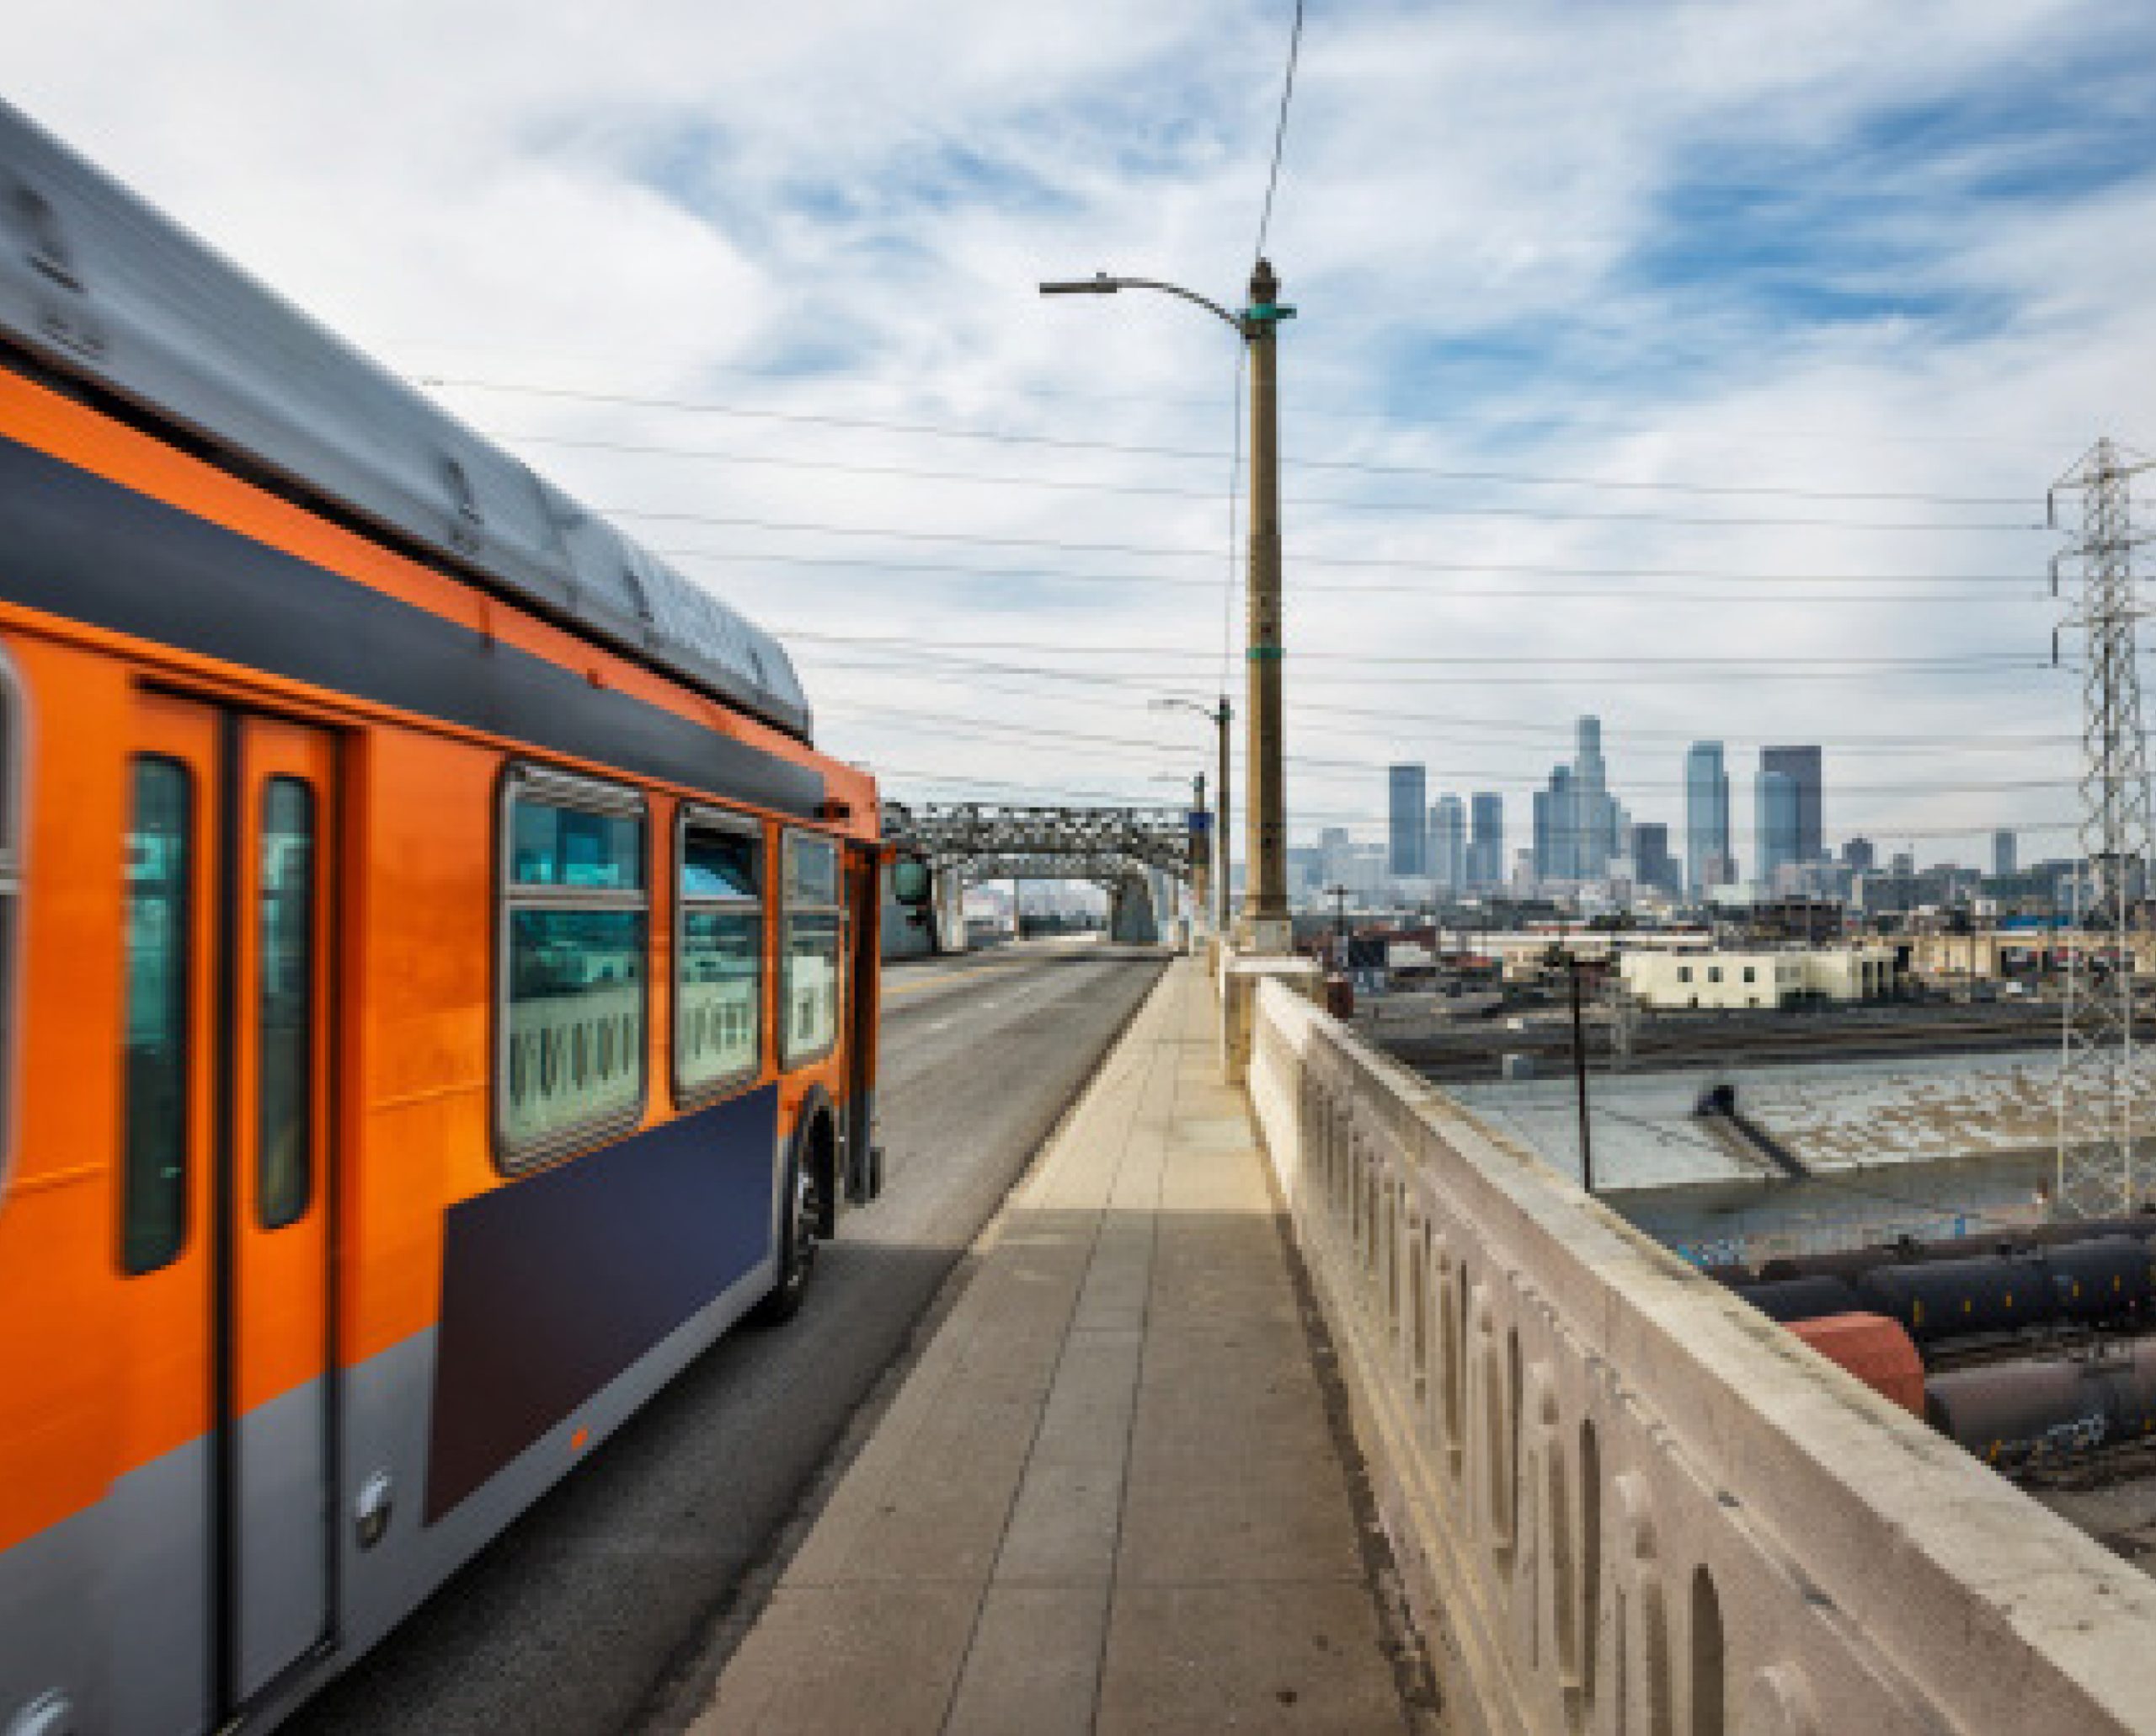
Investment in freeway infrastructure alongside historical divestment from public transportation have contributed to car dependency across LA County.
Nearly 50 percent of trips in LA County are 3 miles or less and 66 percent are 5 miles or less.
LA County features more than:
Miles of Freeway
Driven Daily

Historical redlining continues to contribute to a present-day price gap in auto insurance premiums between BIPOC and white neighborhoods, as well as between lower-and higher-income neighborhoods. This disparity is likely the result of premium rate factors influenced by formerly redlined zip codes and impacted home mortgage rates.
The costs and benefits of this transportation system are distributed inequitably. Although communities of color and low-income communities are more likely to live near freeways, people of color—particularly Black and Latino residents—and low-income individuals in LA County disproportionately lack access to cars. These communities are thus more likely to rely on transit alternatives including public transportation, walking and biking.

Public transit options were historically dismantled throughout LA County as officials and decision-makers prioritized freeway and roadway construction over rail, bus, cycling and pedestrian infrastructure. Suburban growth altered employment opportunities in central urban areas, contributing to a decline in local services. As a result, lower car ownership rates, especially among low-income communities and communities of color, further separates individuals from key services like jobs, education, healthcare and cultural opportunities.
Wealthier communities were and are more likely to have resources—including political and economic power, the ability to take time off from work to attend public meetings and preexisting awareness of decision-making processes—to divert displacement and maintain access to vital services. For example, research shows that wealthier households are willing to pay more to avoid living in areas with high congestion delays and accessibility loss.
Transportation is the second-largest cost for most households in LA County at around 19 percent of annual income. Eighty-four percent of residents spend over 15 percent of their annual income on transportation (Source: https://www.saje.net/wp-content/uploads/2023/05/SAJE-The-Road-to-Transit-Equity.pdf).
High transportation costs are felt more deeply by lower-income communities, who already face more challenges from cost-of-living increases.
Almost two-thirds of people with disabilities who report major transportation accessibility problems are low-income.
Similarly, people with disabilities, especially lower-income folks, are more likely to live in households without access to a car. Adults with disabilities are twice as likely as those without disabilities to experience inadequate transportation access. These residents use LA’s public transit at the highest rate and take more trips by walking than LA County residents on average.
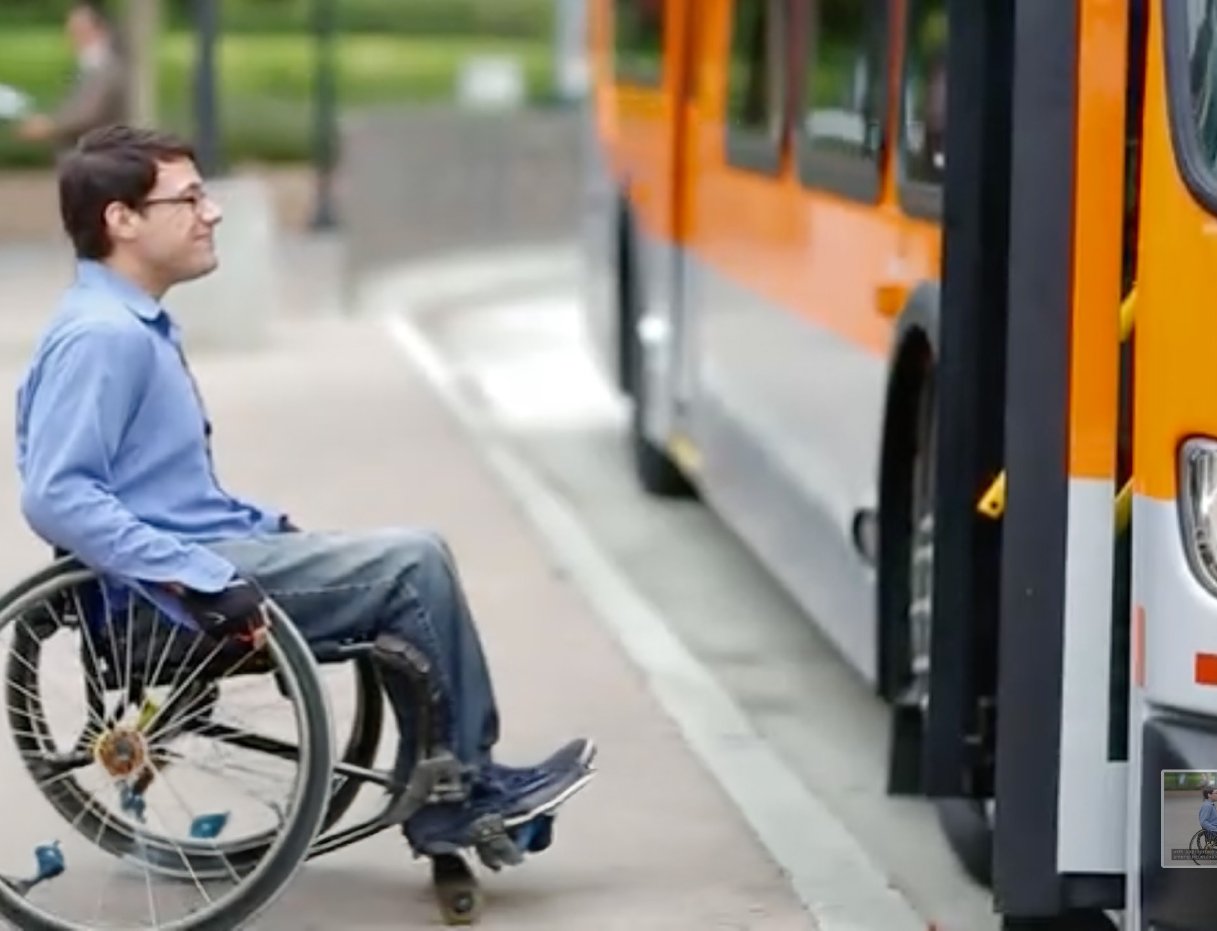

People with disabilities account for 10 percent of all public transportation trips. They also use fixed-route public transit 10x more than paratransit service. Seventeen percent of all trips that people with disabilities take are walking trips, representing a larger share of trips than public transportation or paratransit services combined. People with disabilities take more trips by walking than LA County residents on average, at 14 percent. (Source: https://www.metrans.org/assets/research/psr-19-60_brozen_final-report_jw.pdf; https://escholarship.org/content/qt79j1p8wt/qt79j1p8wt.pdf?t=r41xqx)
Of the nearly 2 million people with disabilities across the U.S. who are home-bound, 560,000 report never leaving home because of transportation difficulties (Source: https://www.bts.gov/archive/publications/special_reports_and_issue_briefs/issue_briefs/number_03/entire).
Locations and services only accessible by walking may be out of reach for those with limited mobility. It is essential that transit facilities, vehicles and rights-of-way are ADA compliant and that accessible transportation options are available for riders of all income levels.