
Urban Heat Island (UHI) Effect

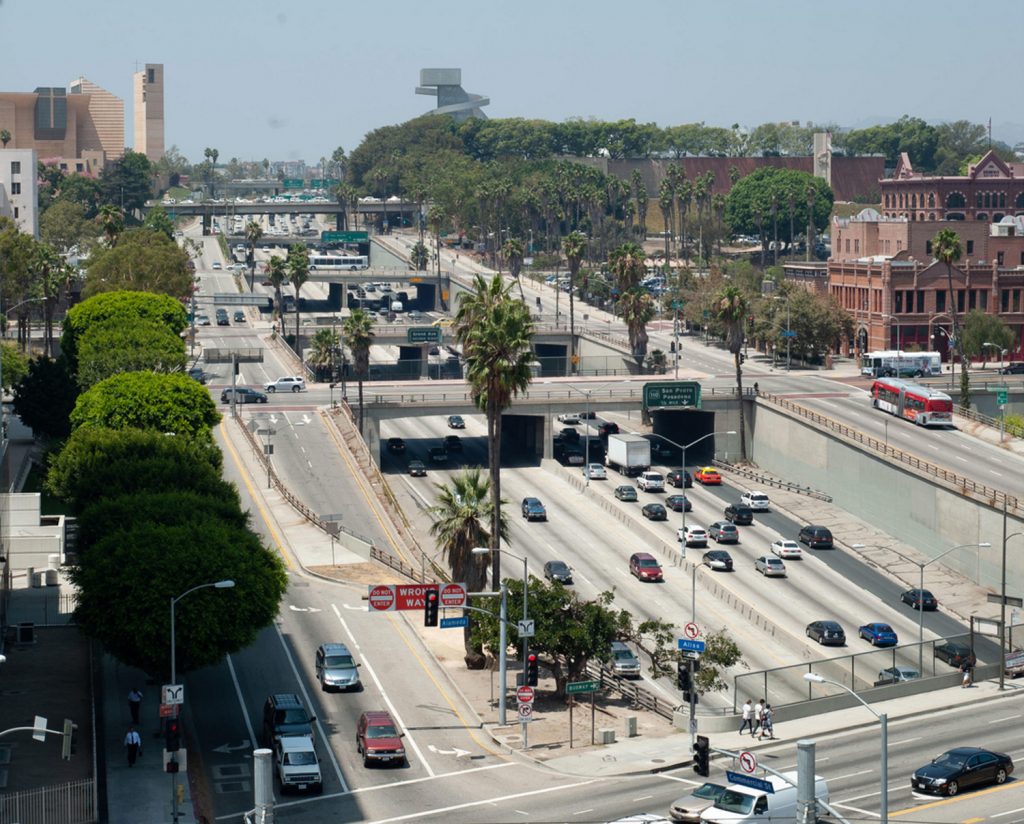
The urban heat island (UHI) effect refers to a phenomenon in which cities tend to experience higher temperatures relative to surrounding areas. As cities expand and develop, new impervious structures such as roads, buildings and other infrastructure displace natural elements like trees, soil and water bodies. These human-made structures absorb and re-emit the sun’s heat less effectively than natural landscapes, contributing to “islands” of higher temperatures in cities. This UHI effect is compounded by other human activities that exacerbate heat impacts, such as vehicles, buildings, and air conditioning. Urban geometry further contributes to heat islands: narrow spaces between tall buildings are known as “urban canyons” that can block wind flow and trap heat. On average, cities tend to be 1-7° F warmer during the daytime and 2-5° F warmer at night compared to outlying areas.
Extreme heat can cause illnesses such as heat stroke, heat exhaustion and heart attacks. These health impacts disproportionately impact low-income and BIPOC communities, who are more likely to live in areas more vulnerable to heat islands and other environmental stressors as a result of historical redlining and disinvestment. Other heat-sensitive populations include elderly populations and children, who are more vulnerable to heat stress and highly dependent on surrounding infrastructure and caregivers. Targeting heat islands supports safer, more equitable transit access, especially for these vulnerable riders, or riders who walk or wait in exposed areas.
Learn More:
- What Are Heat Islands? https://www.epa.gov/heatislands/what-are-heat-islands
- CalEPA Urban Heat Island Interactive Maps: https://calepa.ca.gov/urban-heat-island-interactive-maps/
Understand Your Datasets
These datasets will help planners identify areas at risk for heightened temperatures and the UHI effect. Green spaces and tree canopy can mitigate the urban heat island effect. Studies have found that the presence of vegetation can lower nearby air temperatures as much as 4 °F. By assessing tree canopy, urban temperature and levels of impervious surfaces (i.e., surfaces developed for human infrastructure), Metro staff can identify areas at risk of extreme heat and help target mitigation strategies in key areas. Increased vegetation and shade structures along transit corridors and bus stops can provide cooling for riders and the general public, which not only makes these spaces safer, but also facilitates increased public transit use. For more information about the role Metro plays in preserving and growing LA County’s urban tree canopy, learn more about Metro’s Tree Policy.
Learn More about the Urban Heat Island Effect:
- Heat Island Trends: https://www.epa.gov/heatislands/heat-island-trends
- People and Heat Islands: https://19january2025snapshot.epa.gov/heatislands/people-and-heat-islands/index.html
Example Datasets:
1. Urban Tree Canopy in California: https://www.fs.usda.gov/r05/state-private-tribal/californias-urban-tree-canopy
Instructions: Open the online web map and locate your area of interest. The percentage of tree canopy is available for within Census tract boundaries. Percentage of tree canopy is symbolized using graduated colors, with the least percentage of canopy represented by a dark blue and the most percentage of canopy represented by a bold yellow.
Data Considerations: USDA Region 5 Interactive Maps. Data are from 2018. Urban tree canopy measures the layer of leaves, branches and trunk of the tree that shelters the ground when viewed via aerial images.
2. National Land Cover Database (NLCD) 2021 Impervious Products: https://www.sciencebase.gov/catalog/item/649595c3d34ef77fcb01dc9e
Instructions: Download the “Urban Imperviousness” map product from the National Land Cover Dataset. Open the dataset in a Geographic Information Systems software. Locate your area of interest. Pixels indicate a 900-square meter area and are assigned a value according to the percentage of that area that is an impervious surface (i.e., developed).
Data Considerations: The US Geological Survey (USGS), in partnership with several federal agencies, develops the National Land Cover Database (NLCD). The most current version is NLCD 2021. (See also: https://www.usgs.gov/centers/eros/science/national-land-cover-database)
3. NASA ARSET: Satellite Remote Sensing for Measuring Urban Heat Islands and Constructing Heat Vulnerability Indices: https://www.earthdata.nasa.gov/learn/trainings/satellite-remote-sensing-measuring-urban-heat-islands-constructing-heat
Instructions: This is a series of training videos that will enable participants to use Google Earth to map land surface temperature and source complementary urban heat measurements, identify socioeconomic input to construct heat vulnerability indices and create vulnerability maps.
Data Considerations: LANDSAT data and tutorials on remote sensing for measuring urban heat islands.
4. Climate Central Urban Heat Hot Spots: https://www.climatecentral.org/climate-matters/urban-heat-islands-2023
Instructions: Download Excel data (.xlsx) to identify urban heat hot spots by census tract, jurisdiction and population exposure. Download .kml versions of urban heat island intensity maps for each city.
Data Considerations: This analysis calculates the urban heat island index by census tract within a jurisdiction to estimate the relative heat of these areas due to built environment characteristics. Maps show urban heat hot spots within each city. Study was published in July 2023.
Community Demographics Profiles Alignment
CalEnviroScreen Score
Age by Sex
Older Adults and People with Disabilities
Explore the Index of Indicators in Metro’s Community Demographics Profiles Dashboard here.

Coordinate with Community Members
Supplement Urban Heat Island location and severity assessment with community-based research, such as an experience survey, to identify and understand communities’ experiences of heat, areas in the community most impacted by extreme heat and local adaptation efforts. Consider how your planning efforts can accommodate current and future community needs while limiting impervious ground cover and expanding public green space. Explore implementing other strategies to mitigate the UHI effect such as reflective pavements, green roofs, light-colored building materials and shaded street infrastructure and transit stops. Understand how community development efforts may spur rapid real estate investment and growth in urban areas, which can not only contribute to gentrification but worsen the UHI effect. Meaningfully involving neighborhood stakeholders in planning and implementation efforts is key to preventing green gentrification and exacerbating extreme heat risks.
Questions about this page’s vocabulary terms? Go to the Know the Vocabulary page
Wondering about relevant policies? Go to the Review the Relevant Policies page
Looking for engagement techniques? Go to the Engage Stakeholders page
Related Equity Indicators
Air Quality
Suggested Baseline Indicator: Public transportation investments can contribute to improved air quality and support healthier communities.
Green Space
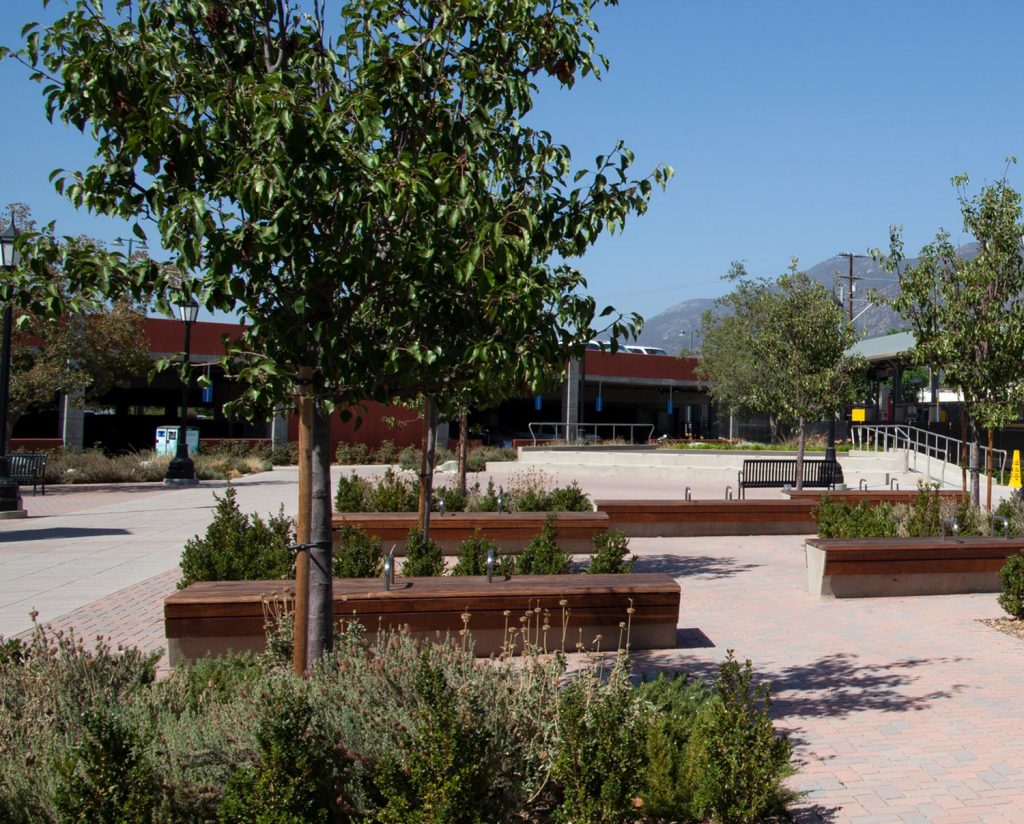
Public transportation enhancements can improve community member access to green space opportunities like parks and playgrounds, improving community health and quality of life.