
Food Security and Accessibility

Food security refers to the physical availability, affordability and stability in access to nutritious and safe food. While this is a broad topic with wide-ranging considerations and factors, in the context of transit, food security and accessibility encompasses the freedom to choose foods that fit culture, preferences and dietary needs without being limited by income or access to a vehicle. It depends on geographical proximity to transit, as well as transit safety and reliability. This relationship to transportation can include the distribution of routes and stops in proximity to residences and grocery stores, cleanliness and safety at the stop and while riding, bus frequency, on-time transit departures and fare affordability.
While food accessibility limitations may correlate with geographic distance, inequities have been shaped across LA County by historical transit planning decisions, as well as exclusionary and disinvestment practices that have concentrated food insecurity conditions in Black, Brown, immigrant, Indigenous and low-income communities. These factors have contributed to the creation of what is known as a food desert, which is a census tract where low-income residents lack reasonable access to a grocery store or supermarket, and therefore lack access to affordable, nutritious and culturally appropriate food options.
Food deserts are often concentrated in communities of color, and as a result Black, Latino, Asian American and Pacific Islander and Indigenous residents experience up to three times the rate of food insecurity compared to higher-income, predominantly white communities in LA County. Limited access to personal vehicles further compounds these challenges. Trips to grocery stores by public transit can on average take three times longer than by car, and transit-accessible food sources are often limited to central commercial areas.
In LA County, food security and accessibility are deeply shaped by transportation: store location, distance from home and how groceries can be reached by foot, bike or transit all play a role. Access to reliable, safe and appropriate transportation can connect riders to grocery stores, markets, free food pantries and other nutritious and affordable food options and is a crucial lever for community health.
Equitable food access is not solely a matter of physical proximity to food retailers, but a reflection of how transportation systems are designed to support dignity, caregiving, cultural belonging and health. Planners can use food insecurity data, affordable grocery locators, demographic data and community health profiles in conjunction with datasets on access to high-quality transit to better understand critical gaps in food access and how a project may impact these factors.
Transit-based food access assessments should account not only for distance traveled, but also cumulative time burden, transfer reliability, frequency of service and the physical labor associated with transporting groceries, mobility aids, strollers or dependent family members. By assessing food access as a key component of transportation planning, planners can identify neighborhoods where transit investments most directly improve food security outcomes and design transportation systems to support equitable food access. Planners can assess and improve commute times, ensure reliable and frequent service to fresh food hubs and foster a shaded, safe, clean and well-lit environment for food to be transported, helping close the gap between food-rich and food-insecure communities across LA County.
Understand Your Datasets
Planners can evaluate food access equity by combining demographic data, food environment data (facility and store locations), food assistance program data and transit network performance.
Demographic Data for Consideration
Race/Ethnicity: Food deserts in LA County are disproportionately concentrated in communities of color. Black, Latino, Asian American and Pacific Islander and Indigenous communities experience up to three times the rates of food insecurity compared to white communities. Planners should prioritize transit improvements that improve food access in communities of color to address historical patterns of disinvestment.
Income: Low-income households are most likely to experience food insecurity, rely on food assistance programs such as CalFresh (SNAP) and depend on public transit to reach grocery stores. Income data can help planners identify communities where transit access to affordable food retailers is most critical. For more information, visit Metro’s EFC Map.
Households Without a Vehicle: Car-free households are most dependent on public transit, walking and/or biking to access food. In LA County, lack of vehicle access is a stronger predictor of food insecurity than geographic proximity to stores alone. For more information, visit the Personal Vehicle Use Equity Indicator.
Age: Seniors and children are particularly vulnerable to food insecurity. Seniors who are transit-dependent may have difficulty traveling long distances or carrying groceries. Children’s food security is linked to school meal programs and proximity to family food resources. Elderly populations are also more likely to benefit from home-delivered meal programs, whose delivery routes may be aided by improved transit access.
Households with Children: Families with children—especially single-parent households and households below the poverty line—face compounded food access burdens. Census data on household composition can help planners identify neighborhoods where transit access to grocery stores and food assistance programs has the greatest impact on family food security.
Immigration Status and Language Access: Undocumented residents and limited English proficiency (LEP) households may face additional barriers to food assistance programs due to eligibility requirements, difficulty of program participation, hesitancy with sharing personal information and language barriers. Understanding the distribution of these populations can support both transit planning and outreach for food assistance programs.
Food Environment and Facility Location Data
Food access depends on both proximity and transit connectivity to a range of food sources including full-service grocery stores, smaller grocery retailers, farmers markets, food pantries, cooperative food systems, urban agriculture and congregate meal programs. Planners can map multiple food source types and assess transit connectivity to each.
Grocery Stores and Supermarkets: Full-service grocery stores often provide shoppers with their primary source of fresh produce, protein and affordable staples. The location of full-service grocery stores relative to transit stops and low-income neighborhoods is central to food desert analysis.
SNAP-Authorized Retailers: Not all food retailers accept SNAP/CalFresh benefits. Mapping SNAP-authorized retailers including grocery stores, smaller markets and farmers markets provides a more accurate picture of food access for low-income residents than grocery store locations alone.
Farmers Markets with EBT/CalFresh Acceptance: Farmers markets that accept Electronic Benefit Transfer (EBT) cards through the CalFresh program help provide low-income residents access to fresh, local produce. While the share of LA County farmers markets accepting EBT increased significantly in the last decade, geographic and transit access to these markets varies significantly across the county.
Food Pantries and Food Banks: Food pantries, food banks and mobile food distribution sites serve as critical emergency food resources for households experiencing acute food insecurity. Transit access to these sites—which are often open only on specific days and times—is particularly important for transit-dependent riders.
Congregate Meal Programs and Senior Nutrition Sites: Senior nutrition programs, congregate meal sites and home-delivered meal programs serve older adults who may be unable to shop independently. Understanding the transit access gaps to these programs can inform both transportation and aging services planning.
The datasets below are organized around understanding who is food insecure, where food is located, whether transit connects people to food and what food assistance resources are available.
Example Datasets:
1. Neighborhood Data for Social Change: Food Insecurity: https://la.myneighborhooddata.org/2021/06/food-insecurity/
Instructions: Use the interactive map to explore data across 10 policy areas. Use Map Options (left-hand side) to view data by Census Tracts, Neighborhoods or Cities. Use Data Options to select a policy area (Food Insecurity) and dataset using the legend to navigate within the selected policy area.
Click the Data Tab (left-hand side) to view charts and explore trends over time. Compare selected areas to Los Angeles County averages. When multiple areas are selected, a black “Aggregated” line shows combined data. Below the chart, select up to 12 geographies to display. Data is available for download.
Data Considerations: USC’s Neighborhood Data for Social Change platform hosts data across several topics, including robust metrics focused on Housing and Real Estate. These datasets on access to food encompass information on food availability and government assistance including food pantries, free and reduced-price lunch, grocery store access (including identifying low-access populations) and SNAP retailers. Planners can use these datasets to better understand local food insecurity risks and inform project planning in the context of a specific project area.
2. LA County DPH Community Health Profiles — Diet, Nutrition, and Food Access Indicators: https://ph-lacounty.hub.arcgis.com/pages/chp
Instructions: Pick a geography of interest to launch the interactive web map in a new tab (i.e., LA County). Using the navigation bar on the left pick a theme, in this case, Social Determinants of Health, Physical Activity and Nutrition Demographics, for example, and add relevant data layers to the map. Available layers include Population in Persistent Poverty Children with Good or Excellent Community Access to Fresh Fruits and Vegetables, Population in Close Proximity to a Supermarket or Grocery Store or Population in Households with Food Insecurity. Planners can additionally access data reports for communities in LA County.
Data Considerations: The Los Angeles County Department of Public Health’s Community Health Profiles data initiative provides local-level data for over 100 indicators known to impact community health and wellbeing, organized under 11 thematic areas. Most of this data was updated in 2023 as part of the Los Angeles County Health Survey, however the “More Info” tab for each datasets provides methodology for each layer. Data are provided for 179 places in Los Angeles County with population sizes of 20,000 or greater and are intended to support efforts to improve health and community conditions across Los Angeles County.
3. USDA Food Environment Atlas: https://www.ers.usda.gov/data-products/food-environment-atlas
Instructions: Planners can access the map viewer, search for specific indicators including SNAP households, or households with children in combination with access to stores and compare across 2015 and 2019 to identify any trends. Planners may also browse by category, including proximity to food stores, local foods, food assistance and food taxes, to better understand the food environment of the project area. All Food Environment Atlas indicators can be viewed in a single mapping application, and data is available for download as a CSV or Excel file.
Data Considerations: The Food Environment Atlas provides a spatial overview of a community’s ability to access healthy food and its success in doing so. The resource hosts statistics on food environment indicators (i.e., number of farmers markets or access to grocery stores) which enable planners to assess food choices as a determinant of health and identify areas where transit investment may support health outcomes. Data is aggregated at the county level and the resource was last updated in 2025.
4. USDA Food Access Research Atlas (FARA): https://www.ers.usda.gov/data-products/food-access-research-atlas/download-the-data
Instructions: Use the link above to download census-tract level data. Alternatively, planners may use this map viewer and navigate to the area of interest. See definitions of LI (low-income) and LA (low-access) as indicators of food insecurity. Toggle varying levels access and income as well as consider the vehicle access layer to assess food access.
Data Considerations: The FARA presents an overview of food access indicators for low-income and other census tracts using measures of supermarket accessibility. It provides food access data for populations within census tracts with which planners can create maps and download census-tract level data to better understand food insecurity risk in the project area. See methodology for defining low-income (LI) and low-access (LA) here. This resource was last updated with 2019 data and should thus be supplemented with more up to date assessments of food access as well as close coordination with community members experiencing food insecurity.
5. Local Retail Locations Data (SNAP, Farmers Markets, Food Pantries):
- USDA SNAP Retailer Locator: SNAP Retailer Locator | Food and Nutrition Service: https://www.fns.usda.gov/snap/retailer-locator
- CalFresh (SNAP) Participation — California Department of Social Services: https://www.cdss.ca.gov/inforesources/research-and-data/calfresh-data-tables
- Receipt of Food Stamps/SNAP in the Past 12 Months for Households (also includes various additional demographic categories): ACS Summary File Table-Based Format: https://www.census.gov/programs-surveys/acs/data/summary-file.html
- California Certified Farmers Markets — CDFA Directory: https://www.cdfa.ca.gov/is/i_&_c/cfm.html
- LA Regional Food Bank — Partner Agency / Pantry Locator: https://www.lafoodbank.org/find-food/pantry-locator/
Instructions: The above sources can help planners map local access to SNAP retailers, farmers markets and food pantries. For each source, navigate to the area of interest or locate the table with data for the project area to identify retail locations. Note trends on retail location density, caseload and areas with limited access to food resources.
Data Considerations: This data should be used in conjunction with community engagement to understand and ground-truth primary sources of nutrition, dependencies and potential barriers to access.
Community Demographics Profiles Alignment
Caltrans Equity Index
Median Household Income
Low-Income Households
BIPOC Population
Equity Focus Communities
Explore the Index of Indicators in Metro’s Community Demographics Profiles Dashboard here.

Coordinate with Community Members
Supplement geographic assessment of food access with community-based research to understand how residents experience food insecurity and transportation barriers to food in their daily lives. Geographic proximity to a grocery store can support planners in establishing a baseline for food access, however, further community engagement is critical to understand other factors: store hours, carrying capacity (particularly for transit riders without a car), perceived safety, cultural food offerings, affordability and language accessibility all shape whether a store is truly accessible to a given community.
Large capital construction projects can create food deserts by impairing access to grocery stores or affordable food during project construction. They can also put small restaurants and grocery businesses at risk of gentrification and displacement following investment in the project area. Consider engaging food access organizations and community members to understand the ways residents currently access food and assess gaps in connectivity and access that a transit project may address. Consider open houses, community surveys and strong partnerships with community-based organizations (CBOs) that work directly in food access, food justice and nutrition advocacy.
Ensure engagement campaigns are conducted in accessible formats and include translation services. Undocumented residents, seniors and households in linguistically isolated communities are historically underrepresented in planning processes and often face the greatest food access barriers. Allocate specific resources to reach these communities and incorporate their lived experience into food access and transit planning.
Questions about this page’s vocabulary terms? Go to the Know the Vocabulary page
Wondering about relevant policies? Go to the Review the Relevant Policies page
Looking for engagement techniques? Go to the Engage Stakeholders page
Related Equity Indicators
Accessibility
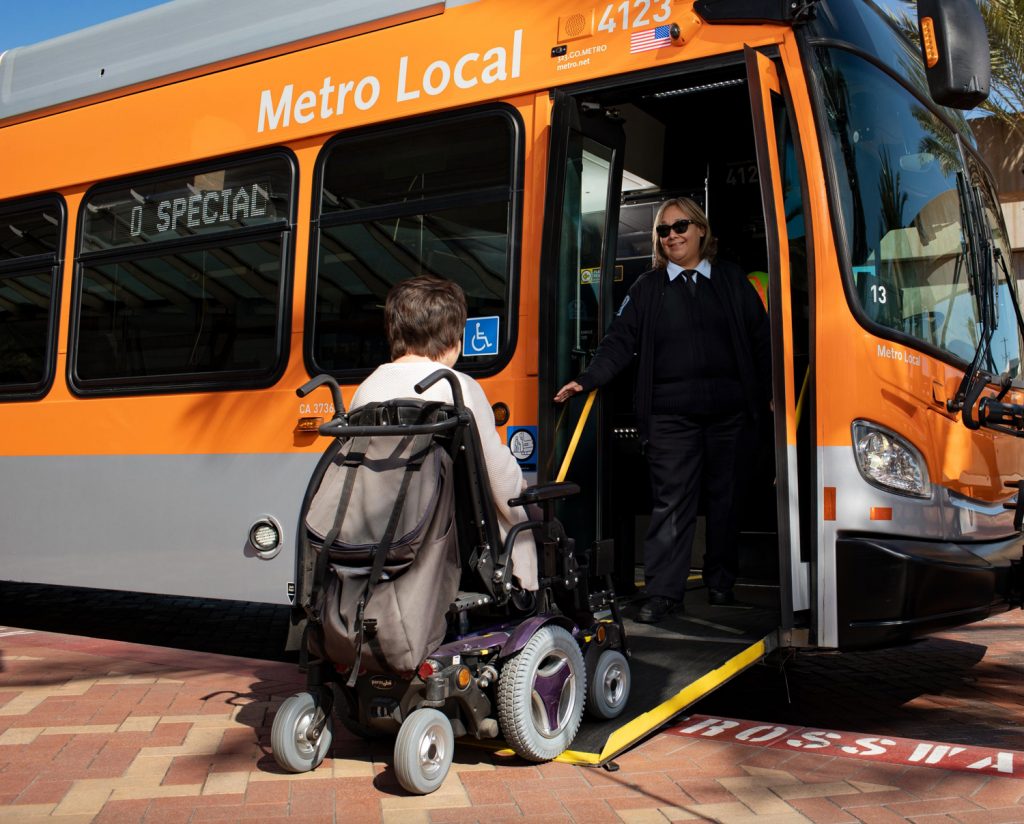
Suggested Baseline Indicator: Accessible transit provides safe mobility options for customers of varying priorities and abilities.

Air Quality
Suggested Baseline Indicator: Public transportation investments can contribute to improved air quality and support healthier communities.

Distance Traveled to Access High-Quality Transit
Suggested Baseline Indicator: Distances traveled to access high quality transit can be impacted by factors like service frequency, service reliability and safety.

Green Space
Public transportation enhancements can improve community member access to green space opportunities like parks and playgrounds, improving community health and quality of life.

Personal Vehicle Use
Suggested Baseline Indicator: Personal vehicle-use patterns can inform opportunities for public transit enhancement projects.

Urban Heat Island (UHI) Effect
Dense, paved urban areas retain more heat which can affect comfort at transit stops, ridership and infrastructure integrity. Planning for shade and cooling can improve rider experience and system resilience.