
Accessibility
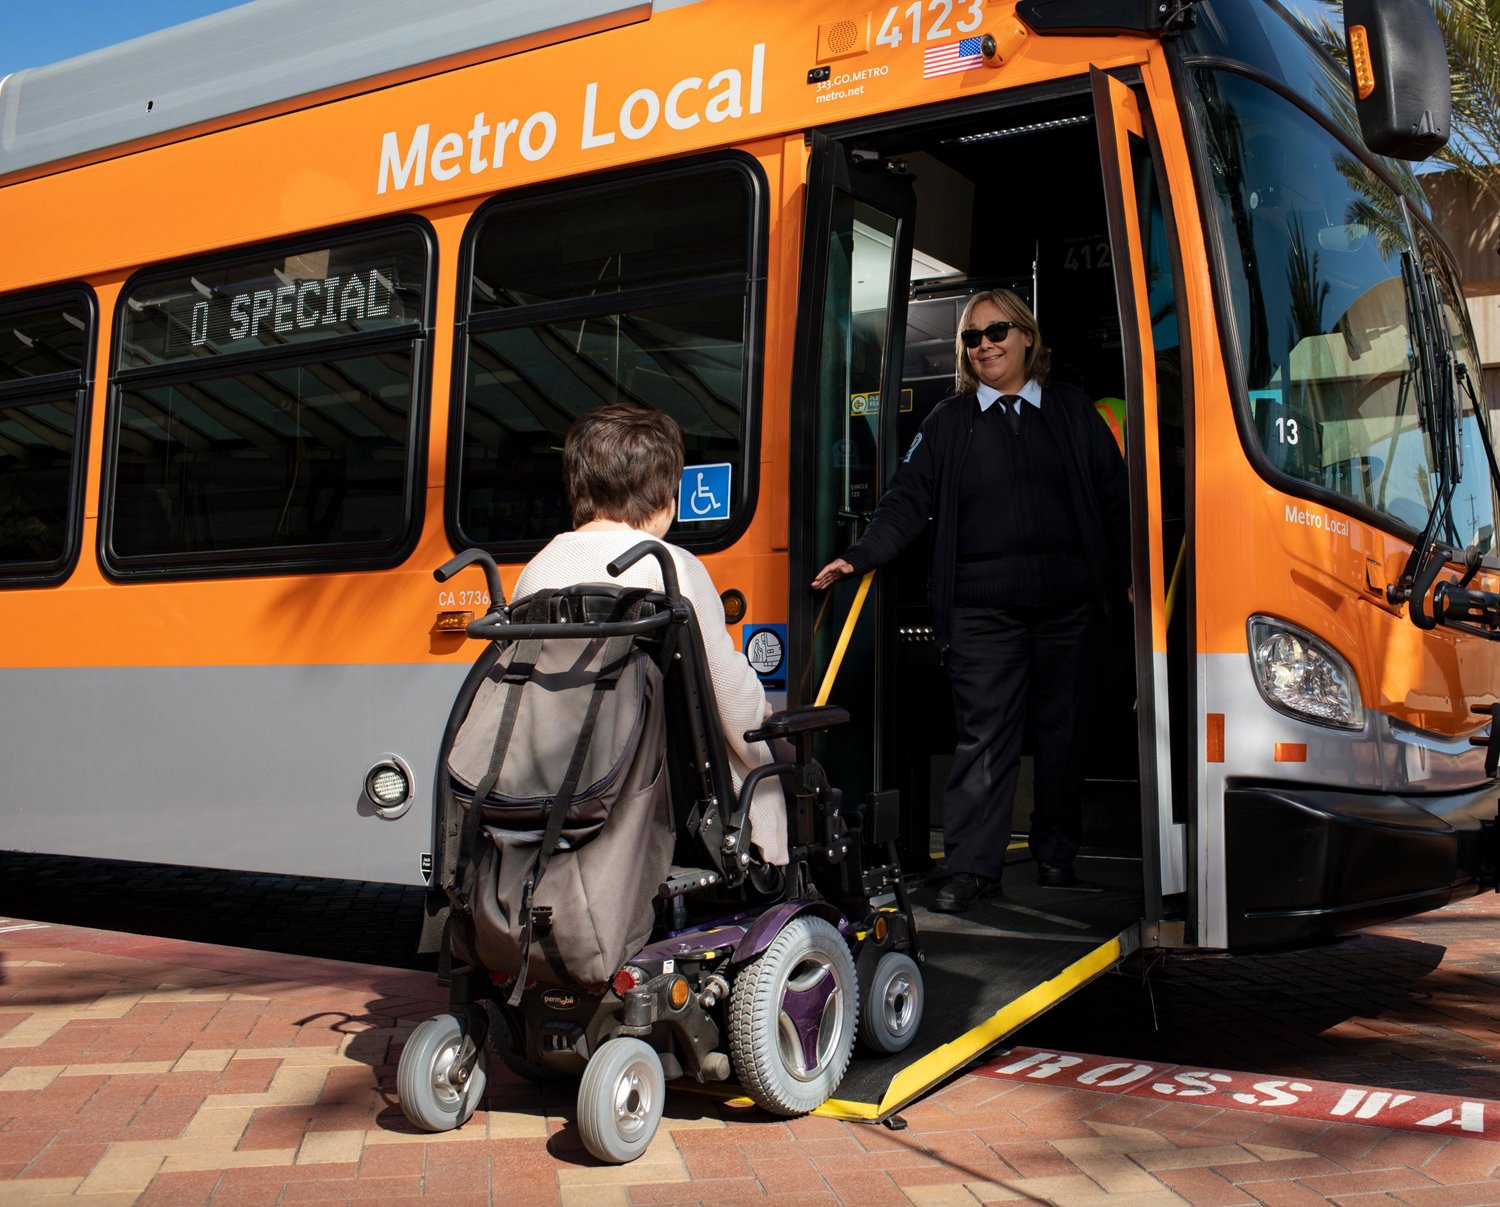
Accessibility is a broad topic with wide-ranging considerations and contexts. While any singular definition has its limitations, in this case “accessibility” refers to the ease with which community members reach and use transportation facilities. Accessibility can be further defined to include the distance from any point to a nearby transit stop, the extent to which travelers can reach transit using unobstructed paths and boarding areas, and the ease with which customers of all abilities and journey types (e.g., solo travelers, riders using a bike, wheelchair or stroller) can access and use the transit network.
While accessibility is often viewed through a public transportation lens, it is important to keep in mind that access to personal automobiles can be a significant predictor of access to opportunity for Equity Focus Communities and can enable improved access to schools, jobs, healthcare and other key resources. While personal vehicles serve a critical role in advancing access to opportunity, this reality is important to consider alongside agency-wide goals of Vehicle Miles Traveled (VMT) reduction and increased public transit ridership.
By improving transit accessibility and mode options, planners can foster a more inclusive public transportation system that both supports riders seeking a variety of destinations and responds to a diverse set of rider needs. Transit accessibility is particularly important for residents in Equity Focus Communities, who are more likely to rely on public transportation to access employment, recreation and other key services.
Understand Your Datasets
Planners can evaluate the many facets of public transit accessibility through wide-ranging lenses and varying datasets. These datasets can focus on demographics, disability and/or transit network design, as described further below.
Demographic Data for Consideration
Race/Ethnicity: Planners can collect data related to the race and ethnicity of community members living near a transit service. Due to lasting impacts of historical redlining and underinvestment, BIPOC communities are more likely to depend on public transportation. Planners can prioritize public transit improvements that benefit these riders to address past harms and improve access to opportunity for all Angelenos.
Age: While accessibility is an important consideration for all transit users, elderly populations, riders with young children and youth riders themselves have particular needs as frequent users of wheelchairs, walkers and strollers. Age data can help planners identify neighborhoods with higher percentages of elderly people and young children.
Gender: Planners may seek to understand the gender distribution of the communities they serve to better tailor connectivity to key services for a particular population.
English Proficiency: Understanding the level of English proficiency in a particular community can support Metro planners developing effective outreach and translation services for their projects.
Income: Low-income households are more likely to experience mobility barriers and be public transportation dependent. For more information, visit Metro’s EFC Map.
Households Without a Vehicle: Personal vehicle use can enhance community member access to jobs, education, healthcare and other important amenities, which can be an important resource for Equity Focus Communities. Understanding communities with higher concentrations of residents without access to personal vehicles can highlight neighborhoods with significant public transportation investment needs. For more information, visit the Personal Vehicle Use Equity Indicator and Metro’s EFC Map.
Disability Data for Consideration
Disabilities refer to conditions of the body or mind that make it more difficult for a person with the condition to do certain activities and interact with the world around them. There are many kinds of disabilities, apparent or non-apparent, which can affect a person’s vision, hearing, movement and cognition.
Planners can conduct a Barrier Analysis to better understand how any physical or environmental barriers (e.g., steep slopes, lack of sidewalks, poor lighting) may be impeding access to transit stops for people with disabilities. For more supporting resources related to transit accessibility and disability data, refer to the links below.
- Investing in Place: https://investinginplace.org/work-2/
- Repairing LA’s Broken Sidewalk Strategy: https://investinginplace.org/wp-content/uploads/2024/09/Repairing-L.A.s-Broken-Sidewalk-Repair-Program_11.17.21.pdf
ADA Compliance: Metro welcomes comments from riders related to their experiences using Metro trains and buses. Complaints submitted by customers who experience accessibility or ADA-related problems are further reviewed for adherence to Metro policies by Metro’s Civil Rights Programs Compliance Department and ADA Compliance staff. These comments may relate to a variety of accessibility-related transit features, including:
- Paratransit service data (e.g., usage statistics, on-time performance, service reliability)
- Accessibility features of transit infrastructure (e.g., elevators, ramps, tactile paving, audible announcements)
- Boarding and alighting data, particularly related to ease of boarding and alighting for riders with strollers, bikes or mobility aids
- Fare payment accessibility data, particularly related to contactless or mobile payment systems
Census data in table S1810 includes individuals with ambulatory difficulty, which refers to disability related to walking and movement. Individuals with ambulatory difficulty may benefit significantly from increased accessibility to public transit. The percentage of individuals with ambulatory difficulty can serve as a proxy for areas in need of improved accessibility features such as wheelchair ramps, elevators or tactile paving.
For more information about accessibility on Metro, visit our Accessibility on Metro page.
Transit Network Design Data for Consideration
The Southern California Association of Governments (SCAG) recently carried out a research effort related to Mobility Hubs, which identified priority locations for future mobility hubs by evaluating factors such as major transit stops, job centers, colleges, sports venues and bike routes. Planners may also refer to resources such as SCAG’s Mobility Hub Design and Implementation Guide, which features a step-by-step guide for local jurisdictions to reference when developing mobility hubs in their communities, as well as SCAG’s Americans with Disabilities Act (ADA) Paratransit Demand Forecast Tool, which helps measure the performance of plans in meeting the mobility needs of disabled and elderly residents. For these SCAG accessibility resources, visit their Transit Program resources.
These data related to transit network design may be further supplemented with internal Metro datasets, which may include:
- Transit facility conditions: Data related to the state of repair of transit stops, vehicles and access paths
- Construction and upgrade plans: Information related to planned improvements to transit infrastructure
- Survey data or policy goals from Metro’s Accessibility Advisory Committee related to accessibility improvements at Metro
Example Datasets:
1. Sex by Age (Table B01001): https://data.census.gov/table/ACSDT1Y2021.B01001
Instructions: Filter for the appropriate area using the “Geographies” tab in the filter pane on the left side of the web page. Select all relevant geographies at the desired resolution. The highest resolution publicly available data are at the block group level.
To calculate the percentage of seniors, first, add population estimates for individuals 65 years old and older. Second, divide total individuals 65 years and older by the total population. Results by Sex available.
Data Considerations: US Census Bureau data from the American Community Survey. Tract and block group data are updated annually in December of each year with a one-year lag. Current data (October 2024) cover the 2018 to 2022 period. Data includes population estimates with breakdowns by disability type, sex, race and Hispanic origin and age.
Data includes population estimates with breakdowns by age, include those under 5 years age and those 65 and older (data must be added from smaller age group ranges).
2. Disability: Disability Characteristics (Table S1810): https://data.census.gov/table?q=disability
Instructions: Filter for the appropriate area using the “Geographies” tab in the filter pane on the left side of the web page. Select all relevant geographies at the desired resolution. The highest resolution publicly available data are at the block group level.
An estimate of the percentage of the total noninstitutionalized population with a disability is available. Additionally, data for individuals with ambulatory difficulty is available.
Data Considerations: US Census Bureau data from the American Community Survey. Tract and block group data are updated annually in December of each year with a one-year lag. Current data (October 2024) cover the 2018 to 2022 period. Data includes population estimates with breakdowns by disability type, sex, race and Hispanic origin and age.
Disability types include ambulatory, self-care, independent living, cognitive, hearing and vision difficulties.
3. Race/Ethnicity: Hispanic or Latino Origin by Race (Table B03002): https://data.census.gov/table?q=B03002
Instructions: Filter for the appropriate area using the “Geographies” tab in the filter pane on the left side of the web page. Select all relevant geographies at the desired resolution. The highest resolution publicly available data are at the block group level.
To calculate the percentage of by race, first, add population estimates for Hispanic or Latino and Not Hispanic or Latino, then divide by the total population. Data provides information on race and ethnicity of residents living near transit service in support of the performance metric.
Data Considerations: US Census Bureau data from the American Community Survey. Tract and block group data are updated annually in December of each year with a one-year lag. Current data (October 2024) cover the 2018 to 2022 period. Data includes population estimates with breakdowns by disability type, sex, race and Hispanic origin and age. Data includes population estimates with breakdowns by race and ethnicity.
4. Limited English-Speaking Households, Characteristics of People by Language Spoken at Home (Tables S1602 and S1603):
a. https://data.census.gov/table/ACSST1Y2023.S1602?g=310XX00US31080
b. https://data.census.gov/table/ACSST1Y2023.S1603?g=310XX00US31080
Instructions: Filter for the appropriate area using the “Geographies” tab in the filter pane on the left side of the web page. Select all relevant geographies at the desired resolution. The highest resolution publicly available data are at the block group level.
Data Instructions: US Census Bureau data from the American Community Survey. Tract and block group data are updated annually in December of each year with a one-year lag. Current data (October 2024) cover the 2018 to 2022 period.
5. Poverty Status in the Past 12 Months of Families, Selected Economic Characteristics for the Civilian Noninstitutionalized Population by Disability Status, Mean Income in the Past 12 Months (Tables S1702, S1811, S1902):
a. https://data.census.gov/table/ACSST1Y2023.S1702?g=310XX00US31080
b. https://data.census.gov/table/ACSST1Y2023.S1811?g=310XX00US31080
c. https://data.census.gov/table/ACSST1Y2023.S1902?g=310XX00US31080
Instructions: Filter for the appropriate area using the “Geographies” tab in the filter pane on the left side of the web page. Select all relevant geographies at the desired resolution. The highest resolution publicly available data are at the block group level.
Data Instructions: US Census Bureau data from the American Community Survey. Tract and block group data are updated annually in December of each year with a one-year lag. Current data (October 2024) cover the 2018 to 2022 period.
Community Demographics Profiles Alignment
Cal Trans Equity Index
Population by Age and Sex
Older Adults and People with Disabilities
Low Income Households
Households with no Access to a Vehicle
BIPOC Population
Equity Focus Communities
Explore the Index of Indicators in Metro’s Community Demographics Profiles Dashboard here.

Coordinate with Community Members
Supplement geographic assessment of demographic distribution with community-based research to understand how LA County’s transportation system could be more inclusive and responsive to communities’ needs. Consider open houses, community surveys and strong CBO partnerships to identify community members’ barriers to transportation and develop solutions that align with community culture and priorities. Ensure public engagement campaigns are conducted in accessible formats and include accessible language and translation services. Elderly populations, families with young children, groups facing language barriers and climate-burdened communities are historically underrepresented in community engagement efforts. Allocate resources toward reaching these hard-to-reach groups to ensure engagement efforts showcase a range of perspectives.
Questions about this page’s vocabulary terms? Go to the Know the Vocabulary page
Wondering about relevant policies? Go to the Review the Relevant Policies page
Looking for engagement techniques? Go to the Engage Stakeholders page
Related Equity Indicators

Active Transportation Infrastructure
Suggested Baseline Indicator: Active transportation infrastructure supports safe walking, cycling, rolling and access to public transit.

Distance Traveled to Access High-Quality Transit
Suggested Baseline Indicator: Distances traveled to access high quality transit can be impacted by factors like service frequency, service reliability and safety.

Personal Vehicle Use
Suggested Baseline Indicator: Personal vehicle-use patterns can inform opportunities for public transit enhancement projects.


Walkability
Walkable neighborhoods provide safe and easy access to transit options, employment, healthcare, education, recreation and other critical services.